A snip, since it's mostly graphs and charts.
Travel on all roads and streets changed by
-0.4 percent for February 2008 as compared
with February 2007. Travel for the month is
estimated to be 216.1 billion vehicle miles.
Cumulative Travel for 2008 changed by -1.1
percent. The Cumulative estimate for the year
is 442.8 billion vehicle miles of travel.
Based on preliminary reports from the State Highway Agencies, travel during February 2008 on all roads
and streets in the nation changed by -0.4 percent resulting in estimated travel for the month at 216.1**
billion vehicle-miles.
This total includes 70.8 billion vehicle-miles on rural roads and 145.2 billion vehicle-miles on urban roads
and streets.
Cumulative Travel changed by -1.1 percent.
Note: Annual travel has been adjusted to match the Highway Performance Monitoring System for 2003. While the
adjustment to total travel was less than one percent, rural travel declined 5% and urban travel increased 4% because of
this adjustment. The larger changes to rural and urban travel are primarily because of the expansion in urban boundaries
reflected in the 2000 census. Travel estimates for 2004 and beyond will also reflect this adjustment.
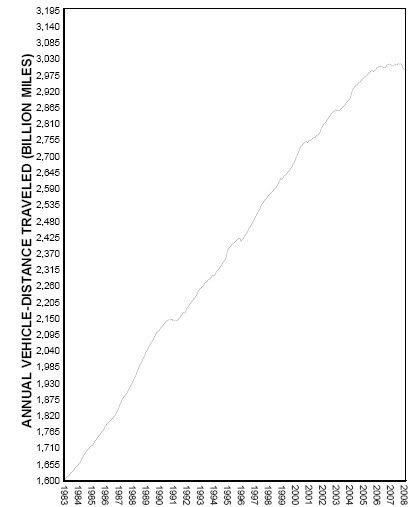
Travel for the current month, the cumulative yearly total, as well as the moving 12-month total on all roads
and streets is shown below. Similar totals for each year since 1983 are also included.
Code: Select all
Year      Year to Date   February  Moving 12-Month
1983        111,828       231,263      1,606,475
1984        117,483       240,013      1,657,857
1985        119,367       243,488      1,720,246
1986        123,526       256,524      1,787,798
1987        135,996       275,914      1,857,631
1988        141,748       290,627      1,939,041
1989        146,732       306,482      2,041,441
1990        153,559       317,159      2,117,716
1991        153,351       311,240      2,141,582
1992        160,204       327,856      2,188,830
1993        162,844       334,524      2,253,820
1994        166,444       335,758      2,297,939
1995        171,053       364,891      2,386,720
1996        176,562       360,027      2,417,911
1997        183,950       374,076      2,496,251
1998        187,167       384,037      2,570,334
1999        191,485       385,067      2,626,392
2000        199,369       402,951      2,697,344
2001        200,933       410,707      2,754,681
2002        208,313       423,543      2,808,446
2003        203,746       422,496      2,854,460
2004        213,824       436,444      2,904,399
2005        220,234       444,006      2,970,053
2006        220,551       452,907      3,001,641
2007        216,931       447,641      3,008,816
2008        216,081       442,808      2,996,422
Link
This graph is a pretty good summary of the trend. Link
A partial step away from the petroleum economy, hopefully some of "miles not driven" start moving towards the more efficient public transit substitutes. Hopefully the trend continues.

