Vaporous wrote:As for Coal: <graph not quoted>
Although coal has a rather limited supply, like other fossil fuels, the graph is quite misleading in its fast increase and rapid decline rates. Such a graph choice when really talking about the world coal situation follows a typical error of looking at only one segment of the total. Virginia is 1% to 2% of world coal production.
With a rather questionable source, the following graph may or may not be a reasonable projection of future world production, but it does illustrate a tendency towards a rather slow increase and decrease over a number of decades:
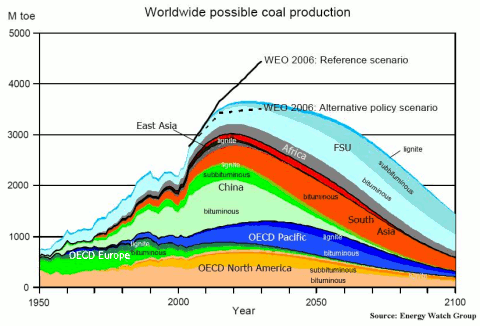
In the above graph, the change rate in coal production is rather gradual considering the long timeframe of the graph, such as frequently on the order of 1% per year.
Vaporous wrote:Who says other minerals don't follow the same pattern?
Fossil fuels and minerals shouldn't be lumped together. Metals and their oxides are what primarily comprise the astronomical mass of the earth and rocky matter in the rest of the cosmos, unlike the lesser supply of fossil fuel produced in the past from some of a thin surface layer of biomass. Some metals are uncommon in earth's crust, more dependent on ores for cheap extraction, but it is impossible to fully run out of an element.
Vaporous wrote:Like say, Copper. note decreased discovery...
The "discovery rate" would merely be the tiny subset of the total mineral supply considered economical under certain assumptions. Besides, to reference a reliable source, the USGS:
World Resources: A recent assessment of U.S. copper resources indicated 550 million tons of copper in identified (260 million tons) and undiscovered resources (290 million tons).9 A preliminary assessment indicates that global land-based resources exceed 3 billion tons. Deep-sea nodules were estimated to contain 700 million tons of copper.
Substitutes: Aluminum substitutes for copper in power cables, electrical equipment, automobile radiators, and cooling and refrigeration tube; titanium and steel are used in heat exchangers; optical fiber substitutes for copper in some telecommunications applications; and plastics substitute for copper in water pipe, drain pipe, and plumbing fixtures.
From here
Since world mine production is currently 16 million tons, the preceding resources amount to enough copper for nominally up to centuries. The world would never entirely run out of copper. Ores beyond a certain low quality are not considered in the preceding resource figures, as there is not billions but rather trillions of tons of total copper in earth's crust. Copper is vastly less common than aluminum or iron, though, so recycling and substitutes like those mentioned above could become particularly worthwhile.
Vaporous wrote:[...] In short, the prices on mineral resources are going up to unsustainable levels, and peak oil is just the primary example of basic supply/demand forces kicking our collective asses.
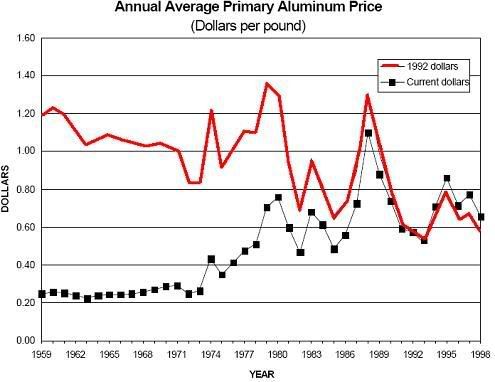
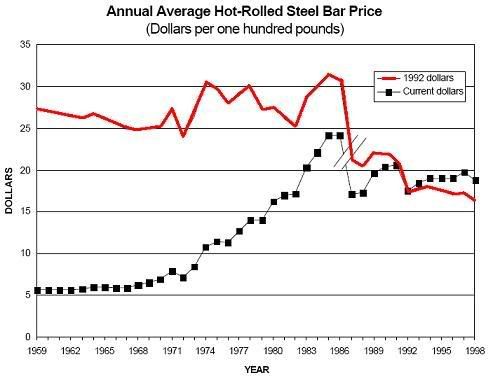
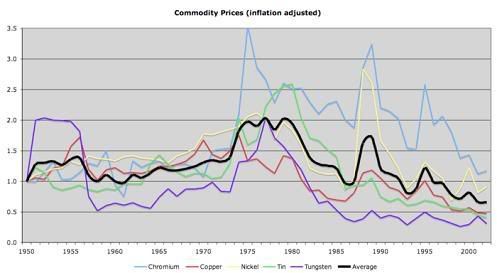
Let's look at prices and production of the most important metals, steel and aluminum, followed by a sample of prices for five other commodities, not for fluctuation over months but overall long-term data (copper, nickel, tin, chromium, and tungsten).
The overall long-term trend is actually mostly a
decrease over the decades. For some commodities that trend may eventually reverse in the future, when economics are too dependent on a limited supply of ores far more concentrated than the average crustal rock (although the distant future centuries from now is so uncertain that there might possibly even be general AI and self-replicating tech by then, making it potentially a moot point).
The very most important metals, iron and aluminum, are common enough in earth's crust (6% and 8% respectively by mass on average, in the form of oxides mixed with others, mostly oxidized silicon).
The following graphs are adjusted for inflation, for the highlighted red price trend in same-year dollars. A graph not adjusted for inflation would instead show a large apparent rise, like a candy bar that cost 10 cents decades ago now costs a dollar, but inflation-adjusted price is what is relevant.
Beginning in the 1960s, an environmental trend which was broadly anti-industrial began to be a major feature of western political thought. Throughout the 1970s it became fashionable to predict general doom for western civilisation for a number of reasons. Concerns about over-use of natural resources were often cited in support of this prognostication, such as the Peak Oil issue. By the end of the 1970s it was common to hear extreme predictions of industrial collapse in a few years due to shortages of raw materials, followed by the fall of western civilisation.
Julian L. Simon and Paul Ehrlich entered in a famous wager in 1980, betting on a mutually agreed upon measure of resource scarcity over the decade leading up to 1990.
The wager
Simon had Ehrlich choose five of several commodity metals. Ehrlich chose 5 metals: copper, chromium, nickel, tin, and tungsten. Simon bet that their prices would go down. Ehrlich bet they would go up. [...]
You could name your own terms: select any raw material you wanted - copper, tin, whatever - and select any date in the future, "any date more than a year away," and Simon would bet that the commodity's price on that date would be lower than what it was at the time of the wager." ... Ehrlich and his colleagues picked five metals that they thought would undergo big price rises: chromium, copper, nickel, tin, and tungsten. Then, on paper, they bought $200 worth of each, for a total bet of $1,000, using the prices on September 29, 1980, as an index. They designated September 29, 1990, 10 years hence, as the payoff date. If the inflation-adjusted prices of the various metals rose in the interim, Simon would pay Ehrlich the combined difference; if the prices fell, Ehrlich et al. would pay Simon. [...]
But by September 1990, without a single exception, the price of each of Ehrlich's selected metals had fallen, and in some cases had dropped through the floor. Chrome, which had sold for $3.90 a pound in 1980, was down to $3.70 in 1990. Tin, which was $8.72 a pound in 1980, was down to $3.88 a decade later.
From here.
When a view contradicts most professional economists or contradicts the largest professional bodies (the IEA, EIA, IPCC, etc), that doesn't automatically mean it is wrong, but such is a red flag warranting very careful checking of references and assumptions. It's very easy for a non-expert like the average internet poster to lack sufficient overall knowledge and make mistakes, whether intentionally or unintentionally.
*****************
*****************
Both in this and in other threads, there's a common tendency to claim that the end of cheap energy is approaching. However, that would only be an accurate statement if about conventional crude oil (although even that is a slow process), rather than an unproven, doubtful assumption about energy in general.
For example, almost all electricity production is already not oil fueled, as discussed in previous posts, and there is nothing making the price of electrical energy in 2025, 2050, 2100, or 2500 necessarily be much more expensive than today ... indeed, price decrease is quite within the realm of the possibility.
There's a need for more nations to do similar to going from this:

(U.S. electricity generation sources, 2005 data)
to this:

(France, electricity generation sources, 2006 data)
For liquid fuel, cheap is a relative term. U.S. gasoline prices have been $2 to $3 per gallon recently, but Europeans have already handled paying ~ $5 to $7 per gallon (due to taxes but the equivalent effect to the consumer of that much production expense).
Expansion of supply can lag behind expansion of desired demand, resulting in price increase for a time. As previously
shown, the recent situation has been the total production of oil plus oil-equivalents increasing but not as fast as the willingness of consumers in the global marketplace to bid higher with economic growth in countries such as China. Since production of substitutes for conventional crude oil is currently only about 20% of the total, its expansion rate of
about 6% annually is not yet enough ... but such exponential growth does vastly change the picture in time.
In the long-term, after perhaps a period of years to decades of high prices, the fundamental production expense does not suggest permanent extreme prices, not even for liquid fuel. For example, whether produced by
cellulosic methods from the vast
amount of non-food biomass available or by other means like nuclear-powered synthesis
from CO2 that may be implemented in future decades, the tendency is not towards $10 or $100 per gallon of gasoline-equivalent ethanol cost.
Rather, for example, the equivalent of several dollars per gallon or less is more likely to be the production cost in the year 2100, considering what even current technology is starting to obtain. There might be little if any conventional crude oil production then, but decoupling of the cost of liquid fuel from the cost of conventional crude oil is the future. Expanded production of synthetics helps conventional crude continue dropping from 80% of the total now to eventually 70%, 50%, 30%, someday ~ 0%.
Meanwhile, electronic technology including rechargeable batteries is only getting better, and the era of cheap electrical energy may not be over but rather potentially enhanced by a true Atomic Age.