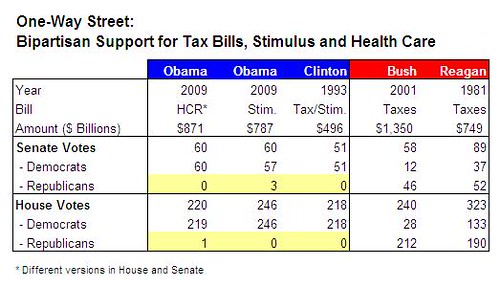
D.Turtle wrote:The following image summarizes that quite well:
You're neglecting the rest of the picture, with a graph showing only part of 4 selectively-chosen years and not the general spending bills over the twenty year period. I'll add more on that a bit later.
D.Turtle wrote:So, basically, the Republicans (with massive support from Democrats) passed the Reagan reforms, Democrats alone passed the Clinton Reforms, Republicans (with some help from Democrats) passed the Bush Reforms.
"Democrats alone passed the Clinton[-era] reforms"? Not living here, I suppose it isn't surprising you have utterly not the slightest idea what happened soon after the 1994 mid-term elections.
Here's part of it:
United States federal government shutdown of 1995
The Republicans at the time were the ones refusing to increase spending as fast as Clinton wanted. (As previously pointed out, they some years later lost their fiscal discipline, but, at that time, they were slowing growth in spending, reducing the deficit).
D.Turtle wrote:Your own image shows your interpretation to be wrong: The problem after 2000/2001 was not a massive increase in spending, but rather a massive decrease in revenue, mostly because of various tax cuts.
No, the massive increase in spending can be seen on the graph. But let's show it more specifically:
In 2001, federal spending (separate from and not including the rest of the government, state & local) was $1.863 trillion, less than $1.991 trillion federal revenues
at the time.
In 2005, federal revenues were
higher at $2.154 trillion. However, federal spending was
vastly, vastly higher at $2.472 trillion.
Federal spending increased 32.7% over those 4 years. (If adjusted both for inflation and for population growth as a rough guide, it increased 15%, still a massive rate of spending increase when it occurred over merely four years).
Even during the relative low point of federal revenues in 2003, they were almost as much (99.6% as much before considering inflation, a bit less after) as federal spending was in 2000, yet spending was 20.7% greater in 2003
than in 2000, leading to a $380 billion deficit that was exceptionally large for the time (though nothing compared to the deficits of more recent history).
Of course, the massive increase in spending aspect only gets more blatant later on. For 2010, federal spending is about $3.7 trillion, while revenues are $2.2 trillion, leading to
the corresponding deficit.*
In short, federal revenues have been hovering around $2 trillion these past few years, while meanwhile spending has gone from $1.9 trillion in 2001 to be $2.5 trillion in 2005, then $3.7 trillion in 2010. Even if such were then adjusted for inflation like in the earlier 2001-2005 example, the conclusion is rather apparent.
That is what one calls a massive increase in spending.
D.Turtle wrote:I'm guessing Spe-f is federal spending, Spe-s is state spending, Spe-l is local spending? What is Spe-x?
That part is correct. Spe-x is transfer to state and local governments (from federal, as opposed to federal direct spending).
* (Minor note: The
link used for such as the historical 2000-2005 data is accurate there, but, with it being a publication compiled in 2008, I intentionally switched to another source as linked above for the more recent data).


