aerius wrote:Historical returns for an America which is very different from what it is now. The US no longer has a rich resource base and a lot of its manufacturing base is also gone. Barring some kind of wholesale policy shift such as building nuke plants by the hundreds or someone discovering the key to nuclear fusion, there isn't anything left in the US to support long term market gains.
Wouldn't you have said the same about the U.S. 10 or 20 years ago? Before, then, and afterwards it has remained the case that investments on average provide payoff. If a company gets money to invest, often it can produce more than its startup cost in output over subsequent years of operation, whether one's talking about a factory being built in 1985, 2005, or 2025.
The Dow Jones dropped by 7% on Monday, attracting a lot of media attention about the perceived crisis because of a 780 point change, but it's already risen back up
another 4.5% yesterday. Short-term variation matters less than the overall trend over decades as prior graphs illustrate.
aerius wrote:A much more accurate historical situation would be Japan in the late 80's and 90's. Like the US at present, they're highly reliant on energy imports, and they'd gotten into a big bubble economy. The Nikkei index was well over 30,000 during this time, after the big kaboom it never saw those heights again. 20 years after the crash and the index is sitting around 12,000. It's still down over 60% after 20 fucking years. That's what the US has ahead of it unless its government shapes up and stops the bullshit that's going on right now.
The Nikkei index has been as follows, closing values end of year:
1965: 1417.83
1975: 4358.43
1985: 13113.32
1995: 19868.20
2005: 16111.43
Source.
Such is relatively low performance. Relative to the world stock market, the Nikkei index has been like an individual poorly performing company compared to a larger stock index. Someone putting all their assets in such a market alone rather than more broadly distributed would be suboptimal.
Overall, world average equity market returns over 1900 to 2006 have averaged
about 5.8% annually, like about +76% per decade.
However, your comparison of perceiving the current U.S. stock market as comparable to Japan's decades ago is inappropriate. Among other differences, the current overall profit to earnings ratio of U.S. stocks is
on the order of 17, while, in contrast, Japan's Nikkei had a P/E ratio of 102 at one point.
One can not and should not think that stocks with a profit/earnings ratio on the order of 17 are inflated remotely as much as ones which once had a 102 ratio.
Besides, for the precise figures of Japan's history, it should be noted that index figures such as the above can be misleading for long-term changes. Does a Nikkei index of 13113 in 1985 versus 16111 in 2005 mean $1 invested in 1985 just became $1.23 in 2005? A lot of people would probably incorrectly assume that with the frequency of places like yahoo having graphs just of the index.
Actually, it's more complicated. It's okay to look at the index for some idea of short-term fluctuations, but one really shouldn't base long-term calculations on it alone.
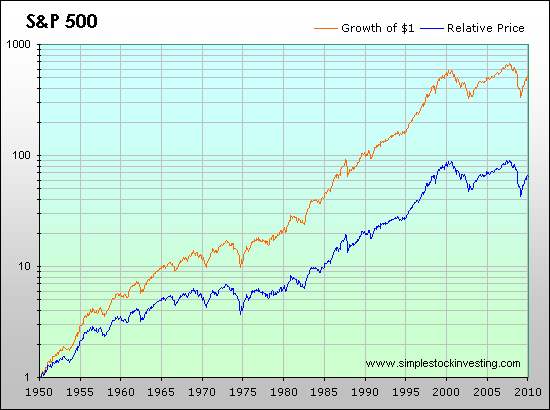
Let's illustrate what's greatly wrong with looking at index alone by doing an example with the U.S. S&P 500. The S&P 500 index reached 20 in around 1951-1952 then reached 1000 for the first time in
around 1998. So can one look at that change in the index and conclude that $1 invested at the former time became $50 fifty years later? No! Actually it became more than that. One has to consider the effect of the dividend component too.
An article
here gives a good description and provides some illustrative graphs.
The following chart illustrates the effect considering dividends and assuming they were reinvested (orange) compared to without considering such, as a difference averaging a few percent per year exponentially adds up over the fifty-some years to be 8 times the return:
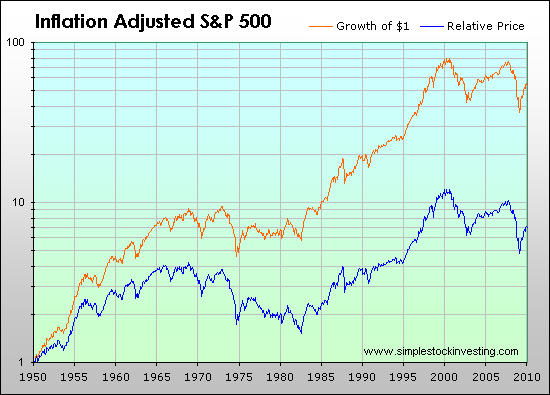
Naturally, the huge difference also occurs adjusting for inflation:
------------
What a program modeled after the Thrift Savings Plan does is give choices. Although as previously illustrated I disagree with your description of the U.S. stock market, if one actually did think that, one could put money into the I fund, which is an international stock index not dependent on the performance of U.S. stocks alone.
There's also the F fund for a bond index, the G fund for government securities, and so on among others. One is able to switch money between them as judged appropriate at a time, like the lifecycle program pulls the money out of stocks during the final few years and puts it into funds without their short-term fluctuation when one's retirement date gets close.

