Hacked E-mails from Climate Scientists released

N&P: Discuss governments, nations, politics and recent related news here.

Moderators: Alyrium Denryle, Edi, K. A. Pital

Post Reply
User avatar
MKSheppard
Ruthless Genocidal Warmonger
Posts: 29842
Joined: 2002-07-06 06:34pm

Re: Hacked E-mails from Climate Scientists released

Post by MKSheppard »

Alyrium Denryle wrote:Good thing that The Shep has no idea what they are referring to. They are referring to the methods they used to statistically adjust certain parts of their data to make it useable.
So why's a negative correction applied to the data from the 1940s, which was a warm period; and then a positive correction applied to the data from later in the century?

Surely the temperature measurements people made back then weren't that out of whack?
"If scientists and inventors who develop disease cures and useful technologies don't get lifetime royalties, I'd like to know what fucking rationale you have for some guy getting lifetime royalties for writing an episode of Full House." - Mike Wong

"The present air situation in the Pacific is entirely the result of fighting a fifth rate air power." - U.S. Navy Memo - 24 July 1944
User avatar
Alyrium Denryle
Minister of Sin
Posts: 22224
Joined: 2002-07-11 08:34pm
Location: The Deep Desert
Contact:

Re: Hacked E-mails from Climate Scientists released

Post by Alyrium Denryle »

MKSheppard wrote:
Alyrium Denryle wrote:Good thing that The Shep has no idea what they are referring to. They are referring to the methods they used to statistically adjust certain parts of their data to make it useable.
So why's a negative correction applied to the data from the 1940s, which was a warm period; and then a positive correction applied to the data from later in the century?

Surely the temperature measurements people made back then weren't that out of whack?
Depending on where they got some of the data from, it can be. Antiquated equipment, non-standardized protocols for collection etc.

Again, not a climatologist. And I have my own literature to comb, but it is entirely reasonable for those corrections to be necessary.
GALE Force Biological Agent/
BOTM/Great Dolphin Conspiracy/
Entomology and Evolutionary Biology Subdirector:SD.net Dept. of Biological Sciences


There is Grandeur in the View of Life; it fills me with a Deep Wonder, and Intense Cynicism.

Factio republicanum delenda est
User avatar
phongn
Rebel Leader
Posts: 18487
Joined: 2002-07-03 11:11pm

Re: Hacked E-mails from Climate Scientists released

Post by phongn »

Alyrium Denryle wrote:
MKSheppard wrote:
Alyrium Denryle wrote:Good thing that The Shep has no idea what they are referring to. They are referring to the methods they used to statistically adjust certain parts of their data to make it useable.
So why's a negative correction applied to the data from the 1940s, which was a warm period; and then a positive correction applied to the data from later in the century?
Surely the temperature measurements people made back then weren't that out of whack?
Depending on where they got some of the data from, it can be. Antiquated equipment, non-standardized protocols for collection etc.
Yes, it's true that adjustments may be needed but it's entirely opaque as to how the adjustments came across. It makes it very difficult to determine what's up - is this a legitimate adjustment or is it a slight-of-hand-trick?

EDIT: And stuff like this gives me no confidence:

Code: Select all

17. Inserted debug statements into anomdtb.f90, discovered that
a sum-of-squared variable is becoming very, very negative! Key
output from the debug statements:
OpEn= 16.00, OpTotSq= 4142182.00, OpTot= 7126.00
DataA val = 93, OpTotSq= 8649.00
DataA val = 172, OpTotSq= 38233.00
DataA val = 950, OpTotSq= 940733.00
DataA val = 797, OpTotSq= 1575942.00
DataA val = 293, OpTotSq= 1661791.00
DataA val = 83, OpTotSq= 1668680.00
DataA val = 860, OpTotSq= 2408280.00
DataA val = 222, OpTotSq= 2457564.00
DataA val = 452, OpTotSq= 2661868.00
DataA val = 561, OpTotSq= 2976589.00
DataA val = 49920, OpTotSq=-1799984256.00
DataA val = 547, OpTotSq=-1799684992.00
DataA val = 672, OpTotSq=-1799233408.00
DataA val = 710, OpTotSq=-1798729344.00
DataA val = 211, OpTotSq=-1798684800.00
DataA val = 403, OpTotSq=-1798522368.00
OpEn= 16.00, OpTotSq=-1798522368.00, OpTot=56946.00
forrtl: error (75): floating point exception
IOT trap (core dumped)

..so the data value is unbfeasibly large, but why does the
sum-of-squares parameter OpTotSq go negative?!!

Probable answer: the high value is pushing beyond the single-
precision default for Fortran reals?
Last edited by phongn on 2009-11-25 04:01pm, edited 1 time in total.
User avatar
Starglider
Miles Dyson
Posts: 8709
Joined: 2007-04-05 09:44pm
Location: Isle of Dogs
Contact:

Re: Hacked E-mails from Climate Scientists released

Post by Starglider »

The fudge factors in the data processing are the only real problem uncovered by this data - but they are a very serious problem. The anti-GW people would do far better for focus on that, rather than the trivial issues which are typical of most human enterprise. Yes, if you dredge over a decade of emails, you will find people bitching about other people, saying things that can be taken out of context to imply cheating, etc. Most business software is of dubious quality, because people are too cheap to pay for quality and because software engineering doesn't have professional bodies that mandate it the way other engineering, finance, law, medicine etc do. Academic software even moreso (even in computer science itself!). Normally it's just inconvenient, not a showstopper - although Shep is correct to say that if we are going to base multi-trillion-dollar economic policies on this, it would be far more sensible to treat the initial academic version as a rough prototype and spend a few tens of millions of dollars making a really solid (and rigorously peer reviewed) computer model.

The gross and arbitrary 'corrections' applied to the data, seemingly by grad students told by department heads to 'back up my predictions or else', is something else; specifically, it looks like blatant, unvarnished fraud. It is the kind of crap we saw in the initial rash of grossly inaccurate humanities attempts at computer models (Club of Rome 1970s malthusianism and others), and which sociology departments persist with to this day - except that no one in government paid much attention to those. I sincerely hope the anti-GW people stop focusing on the superficial email crap, or even crap coding standards, and start focusing on the fraudulent algorithm design. That is the real lying and it would appear to be justification to fire everyone at that organisation (with the hope that the responsible parties never work in science again), and insist on total disclosure of any code and data that is in any way used for government decision-making. That said, we should certainly give them the chance to defend themselves, even though it's hard to imagine a valid justification for this amount of data-fudging.
User avatar
MKSheppard
Ruthless Genocidal Warmonger
Posts: 29842
Joined: 2002-07-06 06:34pm

Re: Hacked E-mails from Climate Scientists released

Post by MKSheppard »

Alyrium Denryle wrote:Depending on where they got some of the data from, it can be. Antiquated equipment, non-standardized protocols for collection etc.
This goes back into a point I made previously; it seems that for climate change science, data collection and verification is much looser and more relaxed than in the more rigid hard sciences, like aerospace engineering, or nuclear engineering; yet we're being asked to implement drastic changes in the ways our economies are laid out and structured; based on the scientific equivalent of a very big and complicated back of napkin equation with lots of erasures and squibbles and crossouts.
"If scientists and inventors who develop disease cures and useful technologies don't get lifetime royalties, I'd like to know what fucking rationale you have for some guy getting lifetime royalties for writing an episode of Full House." - Mike Wong

"The present air situation in the Pacific is entirely the result of fighting a fifth rate air power." - U.S. Navy Memo - 24 July 1944
User avatar
phongn
Rebel Leader
Posts: 18487
Joined: 2002-07-03 11:11pm

Re: Hacked E-mails from Climate Scientists released

Post by phongn »

Starglider wrote:The gross and arbitrary 'corrections' applied to the data, seemingly by grad students told by department heads to 'back up my predictions or else', is something else; specifically, it looks like blatant, unvarnished fraud. It is the kind of crap we saw in the initial rash of grossly inaccurate humanities attempts at computer models (Club of Rome 1970s malthusianism and others), and which sociology departments persist with to this day - except that no one in government paid much attention to those. I sincerely hope the anti-GW people stop focusing on the superficial email crap, or even crap coding standards, and start focusing on the fraudulent algorithm design. That is the real lying and it would appear to be justification to fire everyone at that organisation (with the hope that the responsible parties never work in science again), and insist on total disclosure of any code and data that is in any way used for government decision-making. That said, we should certainly give them the chance to defend themselves, even though it's hard to imagine a valid justification for this amount of data-fudging.
Even ignoring the poor coding standards (SOP for scientific code, alas) the code as it is does not give much confidence into if their model can properly work. Their reporting-station data also seems to be of very poor quality and it looks like some poor guy got years worth of cobbled-together spaghetti code dumped on him :( At first blush it looks like they have fudged models with questionable data coming in and code which does not look like it could really stand up to review.
User avatar
MKSheppard
Ruthless Genocidal Warmonger
Posts: 29842
Joined: 2002-07-06 06:34pm

Re: Hacked E-mails from Climate Scientists released

Post by MKSheppard »

Anyway, this wouldn't be the first time that climate science was politicized. Do I have to point out the whole Nuclear Winter scare of the 1980s? It fell apart pretty fast in legimitate scientific circles once they were able to get into the code that Sagan et al had used to calculate the global climatic effects of a massive nuclear exchange -- here's a hint; in Sagan's code, the earth was a uniformly flat sphere of rock with no mountain ranges or oceans.

It was only with that incredibly beyond simplistic model, that people could replicate the nuclear winter crowd's results.

When they applied the inputs the nuclear winter guys gave to actual climatic models, they got results completely out of variance with what the nuclear winter crowd was claiming.
"If scientists and inventors who develop disease cures and useful technologies don't get lifetime royalties, I'd like to know what fucking rationale you have for some guy getting lifetime royalties for writing an episode of Full House." - Mike Wong

"The present air situation in the Pacific is entirely the result of fighting a fifth rate air power." - U.S. Navy Memo - 24 July 1944
User avatar
MKSheppard
Ruthless Genocidal Warmonger
Posts: 29842
Joined: 2002-07-06 06:34pm

Re: Hacked E-mails from Climate Scientists released

Post by MKSheppard »

To wit from:

The strategic nuclear balance: exchanges and outcomes‎ by Peter Vincent Pry, Page 202:
Subsequent analyses of TTAPS have not supported its findings. Russell Seitz, of Harvard University's Center for International Affairs (and formerly with the geophysics division of C. S. Draper Laboratory), has traced the history of nuclear winter research and found that the trend has been, as climatological models have improved, to predict less severe nuclear winter effects and finally to discredit the phenomenon (see Figure 7.1). Seitz describes some of the erroneous assumptions in TTAPS that were corrected by later studies:

Because so much depended on them, the assumptions embodied in the TTAPS software merit a closer look. Instead of a planet with continents and oceans, the TTAPS model postulated a featureless bone-dry billiard ball. Instead of nights and days, it postulated twenty-four hour sunlight at one-third strength. Instead of realistic smoke emissions, it simply dumped a ten-mile thick soot cloud into the atmosphere instantly. The model dealt with such complications as east, west, winds, sunrise, sunset, and patchy clouds in a stunningly elegant manner—they were ignored. When later computer models incorporated these real-world elements, the flat black sky of TTAPS fell apart into a pale broken shadow that traveled less far and dissipated more quickly. One factor alone— the moderating effect of the oceans—turned out to be the source of a 200 percent error.
and

Figure 7.1. The decline and fall of "nuclear winter." Source: Russell Seitz, "In From the Cold: Nuclear Winter Melts Down," The National Interest (Fall 1986), p. 8.

Image
The figure shows how successive studies of nuclear winter have sharply revised downward its estimated severity, as expressed in the number of "heating degree days" that would result. "Heating degree days" are computed by multiplying how far temperatures drop below 65° F by how many days the lower temperatures last. For example, two days having temperatures of 60 degrees would account for 10 "degree days." As Seitz puts it: "The contrast between the original 22,000-degree-day catastrophe-equivalent to a year and a half of Alaskan winter-and the final few-degree-day cool spell is clearly apparent." The figure also shows that, despite the discrediting of nuclear winter by the scientific community, the popular press incorrectly kept revising upward the mortality estimates associated with nuclear winter. The best evidence suggests that nuclear winter would not occur and that no one would die from brief episodes of cool weather that might attend a counter-force nuclear winter.
"If scientists and inventors who develop disease cures and useful technologies don't get lifetime royalties, I'd like to know what fucking rationale you have for some guy getting lifetime royalties for writing an episode of Full House." - Mike Wong

"The present air situation in the Pacific is entirely the result of fighting a fifth rate air power." - U.S. Navy Memo - 24 July 1944
User avatar
Alyrium Denryle
Minister of Sin
Posts: 22224
Joined: 2002-07-11 08:34pm
Location: The Deep Desert
Contact:

Re: Hacked E-mails from Climate Scientists released

Post by Alyrium Denryle »

MKSheppard wrote:
Alyrium Denryle wrote:Depending on where they got some of the data from, it can be. Antiquated equipment, non-standardized protocols for collection etc.
This goes back into a point I made previously; it seems that for climate change science, data collection and verification is much looser and more relaxed than in the more rigid hard sciences, like aerospace engineering, or nuclear engineering; yet we're being asked to implement drastic changes in the ways our economies are laid out and structured; based on the scientific equivalent of a very big and complicated back of napkin equation with lots of erasures and squibbles and crossouts.
Well the science of predicting climate is relatively new. Short term weather is one thing, but predicting long term trends is another. They get a lot of their data from a period when data collection protocols are not what they are now in terms of standardization, equipment was not updated or maintained regularly etc. They use modern methods to figure out what the temps were (but can only do it in some areas) and then have to reconstruct. It is difficult. The science is no less hard than aerospace. It is just relatively new and the discipline has discovered something that has HUGE implications. Every science, physics included has gone through this (or something similar). None of them discovered something early on that could shake up civilization.

Is there potential for fraud? Possibly. Is the code non-functional in terms of its predictions? I dont know I dont speak in computer code.

If either of those are true, heads will roll. It is guaranteed. Will the consensus change? I dont know. Out of it we will get a better climate model though, predictions will become more clear and we will have more information than we did before. This will allow policy decision to be better informed... Not that politicians will listen anyway.
GALE Force Biological Agent/
BOTM/Great Dolphin Conspiracy/
Entomology and Evolutionary Biology Subdirector:SD.net Dept. of Biological Sciences


There is Grandeur in the View of Life; it fills me with a Deep Wonder, and Intense Cynicism.

Factio republicanum delenda est
User avatar
Serafine666
Jedi Knight
Posts: 554
Joined: 2009-11-19 09:43pm
Location: Sherwood, OR, USA

Re: Hacked E-mails from Climate Scientists released

Post by Serafine666 »

Alyrium Denryle wrote: If either of those are true, heads will roll. It is guaranteed. Will the consensus change? I dont know. Out of it we will get a better climate model though, predictions will become more clear and we will have more information than we did before. This will allow policy decision to be better informed... Not that politicians will listen anyway.
Evidently, the politicians in the US House of Representatives listened (they passed Waxman-Marklay after all). As did the politicians in all the countries that attended the Rio Conference and all the ones that signed Kyoto and all the ones blathering about how we must "do something" and most of the politicians in the US Senate and all the politicians attending the Copenhagen conference. I don't know, Alyrium, but it sure seems like there's quite a few politicians listening to the dire warnings about anthropogenic climate change. Granted, not many of them are as likely to listen if the consensus shifts dramatically (against the prevailing theory about climate change) but science which doesn't give a central government more excuses to increase their staff and enlarge their area of responsibility is less convenient than that which does.
Image
"Freedom is not an external truth. It exists within men, and those who wish to be free are free." - Paul Ernst

The world is black and white. People, however, are grey.

When man has no choice but to do good, there's no point in calling him moral.
User avatar
Alyrium Denryle
Minister of Sin
Posts: 22224
Joined: 2002-07-11 08:34pm
Location: The Deep Desert
Contact:

Re: Hacked E-mails from Climate Scientists released

Post by Alyrium Denryle »

I don't know, Alyrium, but it sure seems like there's quite a few politicians listening to the dire warnings about anthropogenic climate change.
Given the information available at the time, the protocols being considered and implemented were half measures that would not solve the problem. I stand by the statement. Now, if the consensus shifts and we are in fact causing the warming we have observed (that warming is occurring is certain, the cause is not as of week ago) then it does not matter.

However if the consensus does not shift against human causation(considering the underlying theory, and the confirmation from other climate models I think this more likely) or shifts in the direction that our effect is larger than previously thought (which is possible) then all of those measures are for nothing.

Why? Because contrary to your claims governments are more beholden to corporate interests and their voting block. It is in their best interests to appear as if they are doing something, while in fact lining their pockets with kickbacks from Exxon...
GALE Force Biological Agent/
BOTM/Great Dolphin Conspiracy/
Entomology and Evolutionary Biology Subdirector:SD.net Dept. of Biological Sciences


There is Grandeur in the View of Life; it fills me with a Deep Wonder, and Intense Cynicism.

Factio republicanum delenda est
User avatar
Serafine666
Jedi Knight
Posts: 554
Joined: 2009-11-19 09:43pm
Location: Sherwood, OR, USA

Re: Hacked E-mails from Climate Scientists released

Post by Serafine666 »

Alyrium Denryle wrote: Given the information available at the time, the protocols being considered and implemented were half measures that would not solve the problem. I stand by the statement. Now, if the consensus shifts and we are in fact causing the warming we have observed (that warming is occurring is certain, the cause is not as of week ago) then it does not matter.

However if the consensus does not shift against human causation(considering the underlying theory, and the confirmation from other climate models I think this more likely) or shifts in the direction that our effect is larger than previously thought (which is possible) then all of those measures are for nothing.

Why? Because contrary to your claims governments are more beholden to corporate interests and their voting block. It is in their best interests to appear as if they are doing something, while in fact lining their pockets with kickbacks from Exxon...
Of course that is all quite true, Alyrium. Politicians are proposing that we undertake policies that will inflict all of the harm with none of the benefit. However, I think that undertaking any policy at all indicates that they're listening, at least to some degree.
Image
"Freedom is not an external truth. It exists within men, and those who wish to be free are free." - Paul Ernst

The world is black and white. People, however, are grey.

When man has no choice but to do good, there's no point in calling him moral.
Gilthan
Youngling
Posts: 88
Joined: 2009-11-06 07:07am

Re: Hacked E-mails from Climate Scientists released

Post by Gilthan »

I am very sorry to report that the rest of the databases seem to be in nearly as poor a state as Australia was. There are hundreds if not thousands of pairs of dummy stations, one with no WMO and one with, usually overlapping and with the same station name and very similar coordinates. I know it could be old and new stations, but why such large overlaps if that's the case? Aarrggghhh! There truly is no end in sight... So, we can have a proper result, but only by including a load of garbage!
It isn't surprising to read things like this about CRU's troubles when creating the surface station databases. Ground temperature measurement from a grid of stations gets complicated by so many factors: the urban heat island effect (stations frequently within the 1-3% of earth's surface that is urban ... http://www.surfacestations.org/), the sharp decrease in the number of temperature monitoring stations kept active after a couple decades ago, etc.

There is the overall trend reported from processing the data of the surface station grid:

Image

By curious coincidence, reported temperatures rose right after the surface station grid changed drastically (in manners including a great drop in its number of operating stations worldwide):

Image

http://www.uoguelph.ca/~rmckitri/research/nvst.html

(The drastic drop at that time in the number of surface stations kept active is also shown at http://data.giss.nasa.gov/gistemp/stati ... ations.gif).

Rather interesting is how that compares to the more straightforward satellite-based temperature readings of the lower atmosphere:

A NASA chart shows:

Image

http://science.nasa.gov/newhome/essd/at ... o_temp.gif

The above NASA chart from 1979 to 2000 was showing part of a range more fully shown within this, the temperature trend from 1979 to 2008.

Image

As illustrated, there has been up to a 0.1 - 0.2 degree overall temperature increase over the past 40 years, as measured by the most reliable source of satellite measurements. Some predict 6 degrees Celsius temperature rise over the next 91 years, by the year 2100, although there's still some debate over the accuracy of the models giving the more exciting predictions widely reported in the popular media. (That CO2 causes some warming is not in doubt by any reputable scientist, but the exact magnitude of its warming effect when it interacts with water vapor feedback is complicated, among other factors).

Recommended reading, which, for instance, compares the temperature database of the surface station grid to the lower atmosphere air temperatures measured by satellites:

http://www.uoguelph.ca/%7Ermckitri/rese ... .essay.pdf
Gilthan
Youngling
Posts: 88
Joined: 2009-11-06 07:07am

Re: Hacked E-mails from Climate Scientists released

Post by Gilthan »

Correction: A typo refers to a graph as showing the past 40 years, when it rather showed the past 30 years.
User avatar
bobalot
Jedi Council Member
Posts: 1733
Joined: 2008-05-21 06:42am
Location: Sydney, Australia
Contact:

Re: Hacked E-mails from Climate Scientists released

Post by bobalot »

Gilthan wrote:It isn't surprising to read things like this about CRU's troubles when creating the surface station databases. Ground temperature measurement from a grid of stations gets complicated by so many factors: the urban heat island effect (stations frequently within the 1-3% of earth's surface that is urban ... http://www.surfacestations.org/), the sharp decrease in the number of temperature monitoring stations kept active after a couple decades ago, etc.
Anybody who uses http://www.surfacestations.org/ and its creator Anthony Watts as a source is a fucking retard. This arsehole has been debunked so many times its not funny. I have actually pointed this out before.

You honestly think trained scientists don't know how to account for the urban heat island effect? You really think they don't know how to compensate the numerous environment factors around these stations?

Anthony Watts claims on his website there are only "70" stations that were "ideal" and weren't contaminated by the many "complicated factors" such as the urban heat island effect you pointed out. Unfortunately for him, the real scientists at NOAA (The National Oceanic and Atmospheric Administration) debunked his bullshit.

They graphed the so-called ideal stations against the rest of the "contaminated" stations, and this is what they got.

Image
No fucking difference.

Here's a youtube pointing out what a douche Anthony Watts is.


Anthony Watts being such a cocksucker, actually tried to get this video pulled.
"This statement, in its utterly clueless hubristic stupidity, cannot be improved upon. I merely quote it in admiration of its perfection." - Garibaldi

"Problem is, while the Germans have had many mea culpas and quite painfully dealt with their history, the South is still hellbent on painting themselves as the real victims. It gives them a special place in the history of assholes" - Covenant

"Over three million died fighting for the emperor, but when the war was over he pretended it was not his responsibility. What kind of man does that?'' - Saburo Sakai

Join SDN on Discord
Gilthan
Youngling
Posts: 88
Joined: 2009-11-06 07:07am

Re: Hacked E-mails from Climate Scientists released

Post by Gilthan »

bobalot wrote:They graphed the so-called ideal stations against the rest of the "contaminated" stations, and this is what they got.
I congratulate you on cunningly ignoring the NASA chart, etc, in my post, so that you could try to redirect the discussion to become whether someone's choice of 70 unspecified stations matches the unsourced temperature rise data of someone else's choice of 1228 stations. Apparently passing mention of a link to a site you don't like was similar to waving a red flag in front of a bull. The world surface station data set is of such high quality that a scientist working on it said "we can have a proper result, but only by including a load of garbage" (from longer hacked email info, a couple pages into this thread).

But let's return to the matter here:

From NASA at http://science.nasa.gov/newhome/essd/at ... o_temp.gif there is a chart of satellite-measured temperature. Insetting it here into a graph of UAH satellite data, the following shows the lower atmosphere air temperature rise over the past 30 years was under 0.2 degrees Celsius overall:

Image

That's only a very small temperature change, yet it is the result of the most straightforward data set.

Your graph shows 1.8 degrees Fahrenheit temperature rise among certain temperature stations in U.S. cities over the past 30 years (not that U.S. temperatures are much of an indicator of the other 98% of the world's surface area). Mine is from satellites directly measuring low-altitude air temperatures with a lot less layers of uncertainty. It shows a much lesser rate of world temperature rise, 0.2 degrees Celsius or less overall over that time period.
User avatar
bobalot
Jedi Council Member
Posts: 1733
Joined: 2008-05-21 06:42am
Location: Sydney, Australia
Contact:

Re: Hacked E-mails from Climate Scientists released

Post by bobalot »

Gilthan wrote:I congratulate you on cunningly ignoring the NASA chart, etc,in my post,
I was pointing out it was a shitty source, you whiny bitch. Why do I have make a comment on the rest? Does a "good source" make up for the fact you used a shitty source? Even if someone posted something I agreed with but had one dubious source (of many), I would still point it out.
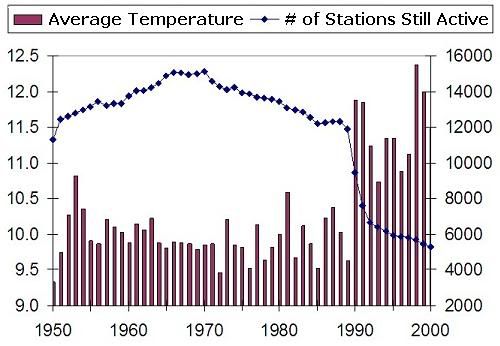
Gilthan wrote: so that you could try to redirect the discussion to become whether someone's choice of 70 unspecified stations matches the unsourced temperature rise data of someone else's choice of 1228 stations.
Redirect? That's entire point of that fucking link you posted. It's claim is that the data from these surface stations is contaminated. I can only assume that you using it to back up your vague claim about the "urban heat island" effect making taking readings difficult.

Unspecified? The link you posted specifies those very stations, unless he took them down in embarrassment after his pwnage by NOAA.

Unsourced? Can't you fucking read? It's from NOAA (The National Oceanic and Atmospheric Administration). Here is a direct link.
Gilthan wrote:Apparently passing mention of a link to a site you don't like was similar to waving a red flag in front of a bull.
No, providing a source that has been repeatedly debunked and using it as some form of "evidence" to back up your vague points gives me the shits. I guess every time I mock at anybody who uses Answers in Genesis as a source in the evolution debate I wasn't pointing out the source they were using is shitty.The real reason must have been I just didn't like the source.
Gilthan wrote: "we can have a proper result, but only by including a load of garbage" (from longer hacked email info, a couple pages into this thread).
First, you berate me for only taking issue with part of your post and then imply that my source was "unsourced" because (it seems) I didn't post a direct link to the literature behind it and you have the balls to post part of somebodies email (which could very well be taken out of context) and then claim it is from a "hacked email" (Wonderful source reference). Seriously, is it easy to be such a shameless hypocrite?

As for your cherry picked quote, is he referring to the surface station data? What exactly data is he exactly talking about? Even if he did something wrong, how exactly does his actions automatically negate the thousands of independent peer review papers on climate change that indicate that it is occurring? Since, you didn't provide any information on where this came from or who even wrote it. I had to spend a bit of time finding it. The guy they are referencing is Ian "Harry" Harris from the University of East Anglia.

Most of the quotes being trumpeted have been taken out of context (including Ian Harris's quote). RealClimate has a list of them, along with this site.

Ian Harris was venting his frustration because he was in the 4 year long process of creating a database from smaller individual databases with differing and sometimes inconstant formats. He was running into all sorts of trouble. The document which this one fucking line comes from is 355 pages in word.

This is what was immediately before that quote. The important bit is in bold font.
Ian Harris wrote:2. The gridder output is lower than 3.0, and much lower than the stations!

I asked Tim and Phil about 1., they couldn't give a definitive opinion. As for 2., their
guesses were correct, I needed to mod the distance weighting. As usual, see gridder.sandpit
for the full info.


So to CLOUD. For over a year, rumours have been circulating that money had been found
to pay somebody for a month to recreate Mark New's coefficients. But it never quite
gelled. Now, at last, someone's producing them! Unfortunately.. it's me.

The idea is to derive the coefficients (for the regressing of cloud against DTR) using
the published 2.10 data. We'll use 5-degree blocks and years 1951-2002, then produce
coefficients for each 5-degree latitude band and month. Finally, we'll interpolate to
get half-degree coefficients. Apparently.

Lots of 'issues'. We need to exclude 'background' stations - those that were relaxed to
the climatology. This is hard to detect because the climatology consists of valid values,
so testing for equivalence isn't enough. It might have to be the station files *shudder*.

Using station files was OK, actually. A bigger problem was the inclusion of strings of
consecutive, identical values (for cloud and/or dtr). Not sure what the source is, as they
are not == to the climatology (ie the anoms are not 0). Discussed with Phil - decided to
try excluding any cell with a string like that of >10 values. Cloud only for now. The result
of that was, unfortunately, the loss of several output values, ie:
This is followed by a long matrix of data (He mentions using MatLab, so I'm assuming its MatLab) and some commentary about how trying to filter the duplicates out made the data not seem "sensible". This is perfectly reasonable. The wrong filtering can screw up data, anybody who has done any scientific work or has analysed data from field tests knows this. Especially data that is not consistent in its format.

After all that comes this comment:
Ian Harris wrote:So, we can have a proper result, but only by including a load of garbage!
So basically, the data he is trying to merge has a lot of duplicate strings, identical values etc. When he tried to filter the crap out, the data went out of whack. So the only way to get a "result" without deterioration of the data is to include a lot of unnecessary "garbage" data such as duplicates.

Nothing sinister, you stupid fuckwit.

Nice going taking a quote completely out of context. There was no doctoring of data as you imply, there was difficulty in creating a new database out of other databases with inconsistent data formatting. He had to include unnecessary duplicate data.

He even later states (important bit in bold font):
OK, got cloud working, have to generate it now.. but distracted by starting on the
mythical 'Update' program. As usual, it's much more complicated than it seems. So,
let's work out the order of events.
So presumably, he managed to fix the problem.
"This statement, in its utterly clueless hubristic stupidity, cannot be improved upon. I merely quote it in admiration of its perfection." - Garibaldi

"Problem is, while the Germans have had many mea culpas and quite painfully dealt with their history, the South is still hellbent on painting themselves as the real victims. It gives them a special place in the history of assholes" - Covenant

"Over three million died fighting for the emperor, but when the war was over he pretended it was not his responsibility. What kind of man does that?'' - Saburo Sakai

Join SDN on Discord
User avatar
bobalot
Jedi Council Member
Posts: 1733
Joined: 2008-05-21 06:42am
Location: Sydney, Australia
Contact:

Re: Hacked E-mails from Climate Scientists released

Post by bobalot »

Gilthan wrote: Image

That's only a very small temperature change, yet it is the result of the most straightforward data set.

Your graph shows 1.8 degrees Fahrenheit temperature rise among certain temperature stations in U.S. cities over the past 30 years (not that U.S. temperatures are much of an indicator of the other 98% of the world's surface area). Mine is from satellites directly measuring low-altitude air temperatures with a lot less layers of uncertainty. It shows a much lesser rate of world temperature rise, 0.2 degrees Celsius or less overall over that time period.
Hey guys, correct me if I'm wrong, isn't this is the change in temperature over time, wouldn't that mean that change of 0.2 degrees would be over that little section of time (mid 2009-2009), not over 30 years?

I'm assuming this is like an acceleration graph. For example,

Time Period 1: 1m/s/s
Time Period 2: 2m/s/s
Time Period 3: 1m/s/s
Time Period 4: -1m/s/s

The average acceleration over the entire length wouldn't be -1m/s/s.

And why does this second graph only go up to the year 2000?
"This statement, in its utterly clueless hubristic stupidity, cannot be improved upon. I merely quote it in admiration of its perfection." - Garibaldi

"Problem is, while the Germans have had many mea culpas and quite painfully dealt with their history, the South is still hellbent on painting themselves as the real victims. It gives them a special place in the history of assholes" - Covenant

"Over three million died fighting for the emperor, but when the war was over he pretended it was not his responsibility. What kind of man does that?'' - Saburo Sakai

Join SDN on Discord
Gilthan
Youngling
Posts: 88
Joined: 2009-11-06 07:07am

Re: Hacked E-mails from Climate Scientists released

Post by Gilthan »

The context in which cbsnews has the quote is the following:

http://www.cbsnews.com/blogs/2009/11/24 ... 1180.shtml
I am very sorry to report that the rest of the databases seem to be in nearly as poor a state as Australia was. There are hundreds if not thousands of pairs of dummy stations, one with no WMO and one with, usually overlapping and with the same station name and very similar coordinates. I know it could be old and new stations, but why such large overlaps if that's the case? Aarrggghhh! There truly is no end in sight... So, we can have a proper result, but only by including a load of garbage!

One thing that's unsettling is that many of the assigned WMo codes for Canadian stations do not return any hits with a web search. Usually the country's met office, or at least the Weather Underground, show up – but for these stations, nothing at all. Makes me wonder if these are long-discontinued, or were even invented somewhere other than Canada!

Knowing how long it takes to debug this suite - the experiment endeth here. The option (like all the anomdtb options) is totally undocumented so we'll never know what we lost. 22. Right, time to stop pussyfooting around the niceties of Tim's labyrinthine software suites - let's have a go at producing CRU TS 3.0! since failing to do that will be the definitive failure of the entire project.

Ulp! I am seriously close to giving up, again. The history of this is so complex that I can't get far enough into it before by head hurts and I have to stop. Each parameter has a tortuous history of manual and semi-automated interventions that I simply cannot just go back to early versions and run the update prog. I could be throwing away all kinds of corrections - to lat/lons, to WMOs (yes!), and more.
Regarding the last sentence, some of the question here is the corrections and adjustments to raw data. Again, this comes back to the big matter here, how such compares to the earlier-graphed satellite data which doesn't go through so many adjustments.
Gilthan
Youngling
Posts: 88
Joined: 2009-11-06 07:07am

Re: Hacked E-mails from Climate Scientists released

Post by Gilthan »

bobalot wrote:
Gilthan wrote: Image

That's only a very small temperature change, yet it is the result of the most straightforward data set.

Your graph shows 1.8 degrees Fahrenheit temperature rise among certain temperature stations in U.S. cities over the past 30 years (not that U.S. temperatures are much of an indicator of the other 98% of the world's surface area). Mine is from satellites directly measuring low-altitude air temperatures with a lot less layers of uncertainty. It shows a much lesser rate of world temperature rise, 0.2 degrees Celsius or less overall over that time period.
Hey guys, correct me if I'm wrong, isn't this is the change in temperature over time, wouldn't that mean that change of 0.2 degrees would be over that little section of time (mid 2009-2009), not over 30 years?
Don't tell me that you're trying to argue that global temperature is rising by 0.2 degrees per half-year and going to rise tens of degrees a decade!

You should look at the overall trend over decades, more so than how it fluctuates up and down over a fraction of year. For instance, if you wanted to cherry-pick a time when it rose by 0.2 degrees in half a year, I could cherry-pick the time on the chart when it dropped by 0.5 degrees in 2004, yet neither of us would be right if we did that.

Such is quite analogous to looking at global versus local data. Sometimes people arguing for large global warming will point to a local temperature record for heat having risen many degrees, and their mirror image among those arguing the opposite will point to a local record for cold temperature having dropped a number of degrees, yet there are always some spots on earth's millions of square miles which deviate from the average trend.
And why does this second graph only go up to the year 2000?
Why? Let me illustrate something. Type global warming temperature into a google image search and observe most graphs that show up end in around 2000-2001.

http://images.google.com/images?q=globa ... =en&tab=wi

It is far rarer to see the past 8-9 years highlighted in press releases. It doesn't look as good on the graphs, since that's when temperatures started stabilizing or heading down a bit for the time being, at least if looking at the most reliable data of satellite measurements. The upper part of the graph, however, shows it, and the UAH data is still available even if not what most people want to highlight or particularly promote to the press.

Anyway, I'm not saying temperatures won't eventually go back up further, as continuing CO2 emissions do cause some warming, but the satellite data illustrates some limits. Recently we've entered a cool phase of the Pacific Multi-Decadal Oscillation, quadrillions of tons of ocean water moving around having an effect on air temperatures.
Last edited by Gilthan on 2009-11-26 03:47pm, edited 1 time in total.
User avatar
Questor
Jedi Council Member
Posts: 1601
Joined: 2002-07-17 06:27pm
Location: Landover

Re: Hacked E-mails from Climate Scientists released

Post by Questor »

bobalot wrote: Hey guys, correct me if I'm wrong, isn't this is the change in temperature over time, wouldn't that mean that change of 0.2 degrees would be over that little section of time (mid 2009-2009), not over 30 years?

I'm assuming this is like an acceleration graph. For example,

Time Period 1: 1m/s/s
Time Period 2: 2m/s/s
Time Period 3: 1m/s/s
Time Period 4: -1m/s/s

The average acceleration over the entire length wouldn't be -1m/s/s.

And why does this second graph only go up to the year 2000?
On the first graph, it says quite clearly "Departure from 1979-1998 avg. temp." So 0.1 is 0.1 degrees above the average temperature for that period. It doesn't seem to be a rate of change graph.
Gilthan
Youngling
Posts: 88
Joined: 2009-11-06 07:07am

Re: Hacked E-mails from Climate Scientists released

Post by Gilthan »

Correction: I made another annoying typo, pointing out the absurdity of extrapolating something to "tens of degrees per decade" when that was to refer to "tens of degrees per century." The point was obvious enough, though.
Jason L. Miles wrote:On the first graph, it says quite clearly "Departure from 1979-1998 avg. temp." So 0.1 is 0.1 degrees above the average temperature for that period. It doesn't seem to be a rate of change graph.
Exactly. The historical mean world temperature in absolute terms is like this, around 14 degrees Celsius:

Image

Discussion of the exact magnitude of climate change is about the deviation from the usual number, by what fraction of a degree average temperatures went up, like this:

Image

Note that graph ends in 1999, right after the peak of El Nino plus the warming phase of PDO (a time favored by widely-publicized global warming graphs since the effects of those superimposed on top of the lesser long-term global warming trend made it look really rapid), so it doesn't show the subsequent temperature trend best seen by scrolling up a bit to the graph earlier, which rather extends to last year.
TheKwas
Padawan Learner
Posts: 401
Joined: 2007-05-15 10:49pm

Re: Hacked E-mails from Climate Scientists released

Post by TheKwas »

I'm far from a climatologist, but my understanding of Satellite data is that it goes through just as many adjustments and manipulation as surface temperature. Satellites aren't able to " directly measur[e] low-altitude air temperatures", but instead they measure radiances. Measurements that must then be inverted to reflect temperatures.

It was precisely because of this difficulty in measuring temperatures from satellite data that caused such a huge discrepancy between satellite data and surface data for a long time.

It was with adjustments to the satellite data that the discrepancy was largely resolved:
"New analyses of balloon-borne and satellite measurements of lower- and mid-tropospheric temperature show warming rates that are similar to those of the surface temperature record and are consistent within their respective uncertainties, largely reconciling a discrepancy noted in the TAR."
http://www.ipcc.ch/pdf/assessment-repor ... g1-spm.pdf
Gilthan
Youngling
Posts: 88
Joined: 2009-11-06 07:07am

Re: Hacked E-mails from Climate Scientists released

Post by Gilthan »

TheKwas wrote:I'm far from a climatologist, but my understanding of Satellite data is that it goes through just as many adjustments and manipulation as surface temperature.
A difference between surface temperature stations and satellite measurements is that the latter uniformly more directly measure over the earth's 200 million square miles of surface area. In contrast, the former are primarily concentrated within convenient areas within or nearby cities, not evenly distributed. From a grid of surface temperature stations which has gotten cut back and increasingly sparse over the past couple decades, processing of data is supposed to accurately extrapolate the gaps and the picture for other millions of square miles, but that introduces new complications.

Keep in mind any single surface temperature station's record is meaningless for global temperature trends (and there are plenty of specific local examples I could post, showing anything over the decades from large warming, to no change, to large cooling, depending on the particular square mile out of 200 million chosen).

What matters is only the aggregate resulting from trying to fill in the gaps and correct for other factors.

As a made-up example, if U.S. station XYZ hypothetically fully accurately corrected for the presence of a city 2.4 miles away during the 1980s which expanded to have its outskirts within 0.63 miles distance later, every year making extremely sophisticated corrections ... what about the thousands of other stations down to random Kazakhstan station WNM? (Some even think past 20th-century surface temperature data may be affected by little factors like how reportedly Soviet villages in Siberia got a Vodka benefit if they reported to the government a temperature dropping below -15 degrees Celsius). Remember that such is trying to exactly quantify a subtle trend of a fraction of a degree in an average over decades, when temperatures are going up and down by many degrees due to regionally varying factors all the time.

If merely a single major country's reports averaged at some time in 20th-century history being off by a degree or two in accurate adjustments, that would affect the global average surface temperature record by only a small fraction of a degree, yet small fractions of a degree are what these subtle trends are all about.

In comparative contrast, satellite data is more straightforward and better.

Let's say those creating the adjusted surface station data grid like the CRU group never would hesitate to admit any weaknesses (as anyone who is on web forums much surely knows the usual behavior of 99% of people is to wholeheartedly be unbiased in emotionally-charged debates, never doing a little fudging to make past statements and what their jobs depend upon look better). Let's say they never do anything like refuse to release their raw data in compliance with a freedom of information act, as they know it would stand up perfectly to all scrutiny. Let's say funding by government departments with certain ideological leanings and by environmentalist groups obviously makes them paragons of accuracy compared to the corporate world. After all, similar assumptions were so valid when it came to another case of climate modeling: portrayals of nuclear winter effects.

Even under all those assumptions, the surface station grid is still much more complex and harder to work with than satellite measurements, easier to experience unintended deviation due to all its interpolations and time-varying adjustments required (like adjusting by the right number of several degrees for increasing urban proximity in a given location, while trying to quantify the exact fraction of a degree average temperature rise over the decades which would have existed aside from that).
It was with adjustments to the satellite data that the discrepancy was largely resolved
The earlier charts of satellite temperatures are straight from what's currently posted on the NASA website and correspond to what's in such as the recent December 2008 report at http://climate.uah.edu/dec2008.htm where at the bottom it shows global average temperature over the years. They're not out-of-date, and they show a temperature rise over the past 30 years that is overall not more than around 0.2 degrees Celsius. Convenient third-party adjustments would have to be taken with a little dose of skepticism in context.
User avatar
bobalot
Jedi Council Member
Posts: 1733
Joined: 2008-05-21 06:42am
Location: Sydney, Australia
Contact:

Re: Hacked E-mails from Climate Scientists released

Post by bobalot »

Jason L. Miles wrote:On the first graph, it says quite clearly "Departure from 1979-1998 avg. temp." So 0.1 is 0.1 degrees above the average temperature for that period. It doesn't seem to be a rate of change graph.
I concede your point about how to interpret the graph.
"This statement, in its utterly clueless hubristic stupidity, cannot be improved upon. I merely quote it in admiration of its perfection." - Garibaldi

"Problem is, while the Germans have had many mea culpas and quite painfully dealt with their history, the South is still hellbent on painting themselves as the real victims. It gives them a special place in the history of assholes" - Covenant

"Over three million died fighting for the emperor, but when the war was over he pretended it was not his responsibility. What kind of man does that?'' - Saburo Sakai

Join SDN on Discord
Post Reply