
I love this, I point out why one of your sources was a shitty debunked source and the FACT you took a quote out of context AND YOU COMPLETELY IGNORE MY CRITICISM REGARDING THESE ISSUES.Gilthan wrote:The context in which cbsnews has the quote is the following:
http://www.cbsnews.com/blogs/2009/11/24 ... 1180.shtml
Regarding the last sentence, some of the question here is the corrections and adjustments to raw data. Again, this comes back to the big matter here, how such compares to the earlier-graphed satellite data which doesn't go through so many adjustments.I am very sorry to report that the rest of the databases seem to be in nearly as poor a state as Australia was. There are hundreds if not thousands of pairs of dummy stations, one with no WMO and one with, usually overlapping and with the same station name and very similar coordinates. I know it could be old and new stations, but why such large overlaps if that's the case? Aarrggghhh! There truly is no end in sight... So, we can have a proper result, but only by including a load of garbage!
One thing that's unsettling is that many of the assigned WMo codes for Canadian stations do not return any hits with a web search. Usually the country's met office, or at least the Weather Underground, show up – but for these stations, nothing at all. Makes me wonder if these are long-discontinued, or were even invented somewhere other than Canada!
Knowing how long it takes to debug this suite - the experiment endeth here. The option (like all the anomdtb options) is totally undocumented so we'll never know what we lost. 22. Right, time to stop pussyfooting around the niceties of Tim's labyrinthine software suites - let's have a go at producing CRU TS 3.0! since failing to do that will be the definitive failure of the entire project.
Ulp! I am seriously close to giving up, again. The history of this is so complex that I can't get far enough into it before by head hurts and I have to stop. Each parameter has a tortuous history of manual and semi-automated interventions that I simply cannot just go back to early versions and run the update prog. I could be throwing away all kinds of corrections - to lat/lons, to WMOs (yes!), and more.
CONCEDE YOU TOOK THE QUOTE OUT OF CONTEXT OR FUCK OFF.
Let's take your latest section, that once again you took out of context. Ian "Harry" Harris vents his frustration of the way the data is organised. He vents ONCE AGAIN about duplicate and overlapping data, which seems to be a continuing problem with merging these databases. No where (despite your implications) does he declare that he will be manipulating the data, which is what you and the rest of your fellow shit sniffers have been implying. All he says is that the problem of organising this data iwill be very complex, not impossible.
All you can imply is that he MIGHT have manipulated the data, which once again is pure speculation. Interestingly enough you picked a section of text (before a whole heap of example data and more venting) just before the END of the files that was illegally hacked from the email server. He could have very well overcome this problem, we simply don't know, we don't know what he did after this.
He has repeatedly described problems as insurmountable, only to overcome them. Since he managed to produce a merged database, I assume he did manage to overcome this problem as well.
Isn't it funny that you picked this particular paragraph to quote? All the other issues he faced he eventually overcame, so you pick a paragraph towards the end of the file, which we don't know the resolution to. How convenient.
He does however state later on (towards the very end).
[quote="Ian "Harry" Harris"]Wrote metacmp.for. It accepts a list of parameter databases (by default, latest.versions.dat) and
compares headers when WMO codes match. If all WMO matches amongst the databases share common
metadata (lat, lon, alt, name, country) then the successful header is written to a file. If,
however, any one of the WMO matches fails on any metadata - even slightly! - the gaggle of
disjointed headers is written to a second file. I know that leeway should be given, particularly
with lats & lons, but as a first stab I just need to know how bad things are. Well, I got that:[/quote]
So he seems to have developed away to organise the data without overly comprising the "to lat/lons, to WMOs (yes!), and more." We don't know what happens after this because there is not much more in the hacked file.
So your implication that he manipulated the data is without a single shred of evidence. What a surprise.
Lets get on to how you put words into my mouth.
When did I say or even imply that?. YOU pointed out that the change in temperature over 30 years is 0.2 degrees. I was questioning if that was what the graph really indicated. At no point did I say or even imply that a mere 0.2 degree rise in temperature per year would lead to rises in temperature of tens of degrees.Gilthan wrote:Don't tell me that you're trying to argue that global temperature is rising by 0.2 degrees per half-year and going to rise tens of degrees a decade
CONCEDE YOUR STRAWMAN YOU DISHONEST PIECE OF SHIT.
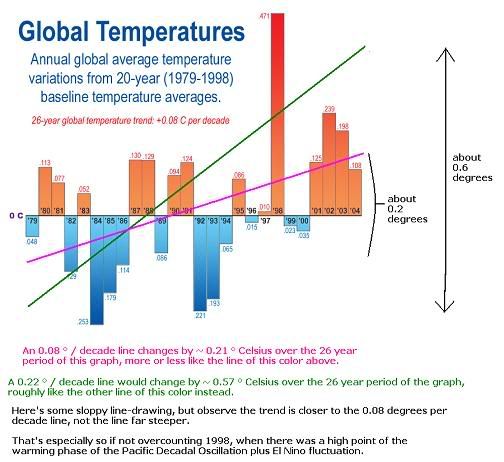
What the fuck does this have to do with the issues that I raised? I pointed out you used a shitty discredited source and you purposely took a quote out of context.Gilthan wrote:You should look at the overall trend over decades, more so than how it fluctuates up and down over a fraction of year. For instance, if you wanted to cherry-pick a time when it rose by 0.2 degrees in half a year, I could cherry-pick the time on the chart when it dropped by 0.5 degrees in 2004, yet neither of us would be right if we did that.
Such is quite analogous to looking at global versus local data. Sometimes people arguing for large global warming will point to a local temperature record for heat having risen many degrees, and their mirror image among those arguing the opposite will point to a local record for cold temperature having dropped a number of degrees, yet there are always some spots on earth's millions of square miles which deviate from the average trend.
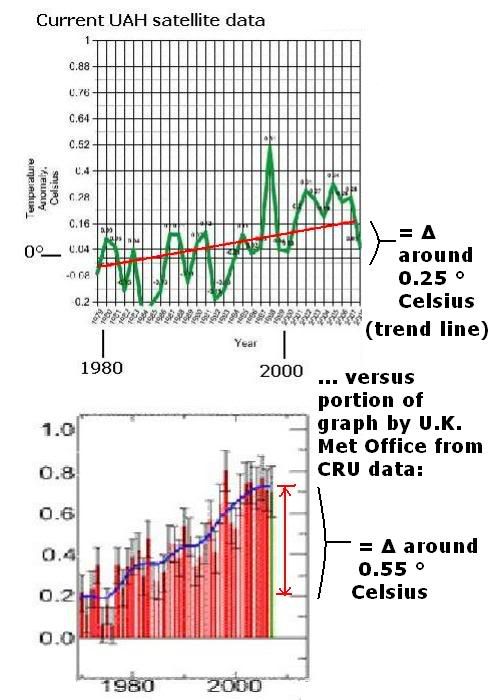
So you are saying the last 8-9 years is an anomaly? Since you take such stock in NASA readings.Gilthan wrote:It is far rarer to see the past 8-9 years highlighted in press releases. It doesn't look as good on the graphs, since that's when temperatures started stabilizing or heading down a bit for the time being, at least if looking at the most reliable data of satellite measurements. The upper part of the graph, however, shows it, and the UAH data is still available even if not what most people want to highlight or particularly promote to the press.
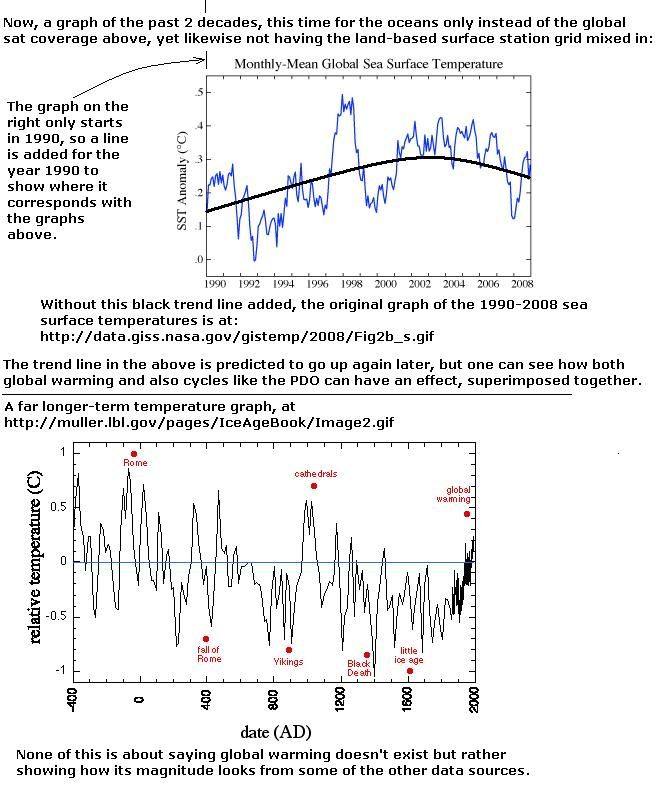
Anyway, I'm not saying temperatures won't eventually go back up further, as continuing CO2 emissions do cause some warming, but the satellite data illustrates some limits. Recently we've entered a cool phase of the Pacific Multi-Decadal Oscillation, quadrillions of tons of ocean water moving around having an effect on air temperatures.

SourceFigure 1, above. (a) Annual surface temperature anomaly relative to 1951-1980 mean, based on surface air measurements at meteorological stations and ship and satellite measurements of sea surface temperature. (b) Global map of surface temperature anomalies for 2007. (Figure also available as large GIF or PDF.)
As for this load of bullshit.
I followed that link at the bottom of the image and all it shows is this:Gilthan wrote: Exactly. The historical mean world temperature in absolute terms is like this, around 14 degrees Celsius:

How the fuck do you get a global mean temperature of 14 degrees from that?185001185012 -0.43
185101185112 -0.29
185201185212 -0.29
185301185312 -0.33
185401185412 -0.29
185501185512 -0.34
185601185612 -0.41
185701185712 -0.49
185801185812 -0.49
185901185912 -0.36
186001186012 -0.39
186101186112 -0.42
186201186212 -0.51
186301186312 -0.33
186401186412 -0.51
186501186512 -0.31
186601186612 -0.31
186701186712 -0.34
186801186812 -0.31
186901186912 -0.31
187001187012 -0.31
187101187112 -0.34
187201187212 -0.28
187301187312 -0.34
187401187412 -0.39
187501187512 -0.41
187601187612 -0.37
187701187712 -0.13
187801187812 -0.01
187901187912 -0.26
188001188012 -0.25
188101188112 -0.25
188201188212 -0.25
188301188312 -0.30
188401188412 -0.37
188501188512 -0.36
188601188612 -0.29
188701188712 -0.38
188801188812 -0.34
188901188912 -0.22
189001189012 -0.42
189101189112 -0.38
189201189212 -0.48
189301189312 -0.51
189401189412 -0.43
189501189512 -0.42
189601189612 -0.23
189701189712 -0.25
189801189812 -0.39
189901189912 -0.31
190001190012 -0.24
190101190112 -0.30
190201190212 -0.43
190301190312 -0.49
190401190412 -0.54
190501190512 -0.42
190601190612 -0.34
190701190712 -0.52
190801190812 -0.55
190901190912 -0.56
191001191012 -0.54
191101191112 -0.56
191201191212 -0.50
191301191312 -0.49
191401191412 -0.32
191501191512 -0.24
191601191612 -0.43
191701191712 -0.50
191801191812 -0.40
191901191912 -0.37
192001192012 -0.33
192101192112 -0.25
192201192212 -0.37
192301192312 -0.34
192401192412 -0.34
192501192512 -0.25
192601192612 -0.16
192701192712 -0.24
192801192812 -0.24
192901192912 -0.35
193001193012 -0.14
193101193112 -0.11
193201193212 -0.14
193301193312 -0.27
193401193412 -0.14
193501193512 -0.17
193601193612 -0.13
193701193712 -0.02
193801193812 0.02
193901193912 0.04
194001194012 0.01
194101194112 0.06
194201194212 -0.01
194301194312 0.01
194401194412 0.12
194501194512 -0.03
194601194612 -0.15
194701194712 -0.18
194801194812 -0.17
194901194912 -0.19
195001195012 -0.28
195101195112 -0.14
195201195212 -0.08
195301195312 -0.02
195401195412 -0.22
195501195512 -0.24
195601195612 -0.33
195701195712 -0.07
195801195812 -0.00
195901195912 -0.06
196001196012 -0.10
196101196112 -0.02
196201196212 -0.01
196301196312 0.01
196401196412 -0.27
196501196512 -0.21
196601196612 -0.14
196701196712 -0.13
196801196812 -0.15
196901196912 -0.03
197001197012 -0.07
197101197112 -0.18
197201197212 -0.08
197301197312 0.05
197401197412 -0.21
197501197512 -0.16
197601197612 -0.25
197701197712 0.01
197801197812 -0.06
197901197912 0.05
198001198012 0.07
198101198112 0.12
198201198212 0.01
198301198312 0.17
198401198412 -0.02
198501198512 -0.04
198601198612 0.03
198701198712 0.18
198801198812 0.18
198901198912 0.11
199001199012 0.25
199101199112 0.20
199201199212 0.07
199301199312 0.10
199401199412 0.17
199501199512 0.28
199601199612 0.14
199701199712 0.35
199801199812 0.53
199901199912 0.31
200001200012 0.28
200101200112 0.41
200201200212 0.46
200301200312 0.47
200401200412 0.45
200501200512 0.48
200601200612 0.43
200701200712 0.41
200801200812 0.34
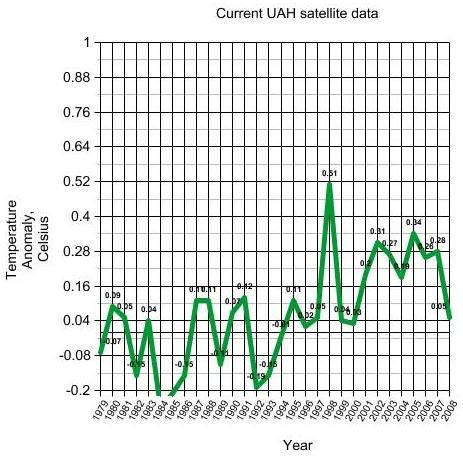
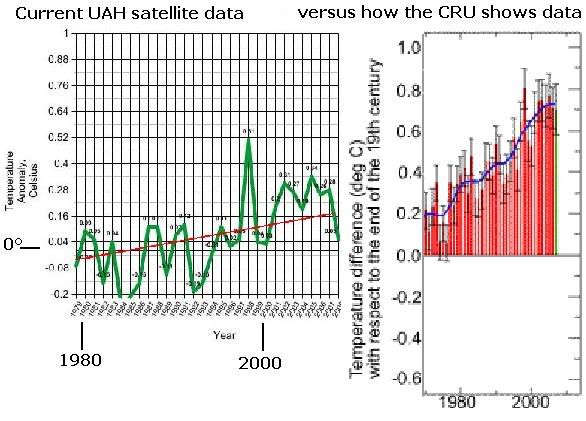
If you had actually bothered to explore the website, you would have found this graph, which is pretty much in line with the NASA graph.

The source that you use is Jennifer Marohasy, an source in Australia that has been repeatedly debunked. She works for a right-wing institute and has absolutely no qualifications in any of the relevant scientific fields related to climatology. Another wonderful source.
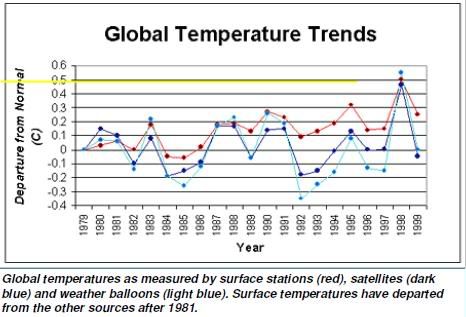
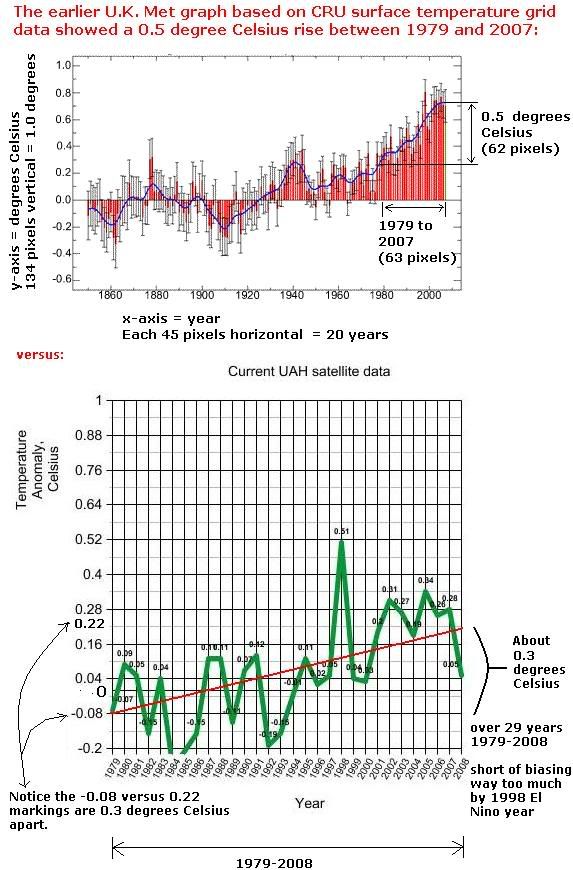
Once again you post an image excluding the last 10 years.Gilthan wrote:
Note that graph ends in 1999, right after the peak of El Nino plus the warming phase of PDO (a time favored by widely-publicized global warming graphs since the effects of those superimposed on top of the lesser long-term global warming trend made it look really rapid), so it doesn't show the subsequent temperature trend best seen by scrolling up a bit to the graph earlier, which rather extends to last year.
In that long meandering load of bullshit, you fail to post a single source backing up any of your claims. Nobody here is impressed of paragraphs of unsubstantiated claims.Gilthan wrote:A difference between surface temperature stations and satellite measurements is that the latter uniformly more directly measure over the earth's 200 million square miles of surface area. In contrast, the former are primarily concentrated within convenient areas within or nearby cities, not evenly distributed. From a grid of surface temperature stations which has gotten cut back and increasingly sparse over the past couple decades, processing of data is supposed to accurately extrapolate the gaps and the picture for other millions of square miles, but that introduces new complications.
Keep in mind any single surface temperature station's record is meaningless for global temperature trends (and there are plenty of specific local examples I could post, showing anything over the decades from large warming, to no change, to large cooling, depending on the particular square mile out of 200 million chosen).
What matters is only the aggregate resulting from trying to fill in the gaps and correct for other factors.
As a made-up example, if U.S. station XYZ hypothetically fully accurately corrected for the presence of a city 2.4 miles away during the 1980s which expanded to have its outskirts within 0.63 miles distance later, every year making extremely sophisticated corrections ... what about the thousands of other stations down to random Kazakhstan station WNM? (Some even think past 20th-century surface temperature data may be affected by little factors like how reportedly Soviet villages in Siberia got a Vodka benefit if they reported to the government a temperature dropping below -15 degrees Celsius). Remember that such is trying to exactly quantify a subtle trend of a fraction of a degree in an average over decades, when temperatures are going up and down by many degrees due to regionally varying factors all the time.
If merely a single major country's reports averaged at some time in 20th-century history being off by a degree or two in accurate adjustments, that would affect the global average surface temperature record by only a small fraction of a degree, yet small fractions of a degree are what these subtle trends are all about.
In comparative contrast, satellite data is more straightforward and better.
Post EVIDENCE for what you are implying here or retract this paragraph.Gilthan wrote:Let's say those creating the adjusted surface station data grid like the CRU group never would hesitate to admit any weaknesses (as anyone who is on web forums much surely knows the usual behavior of 99% of people is to wholeheartedly be unbiased in emotionally-charged debates, never doing a little fudging to make past statements and what their jobs depend upon look better). Let's say they never do anything like refuse to release their raw data in compliance with a freedom of information act, as they know it would stand up perfectly to all scrutiny. Let's say funding by government departments with certain ideological leanings and by environmentalist groups obviously makes them paragons of accuracy compared to the corporate world. After all, similar assumptions were so valid when it came to another case of climate modeling: portrayals of nuclear winter effects.
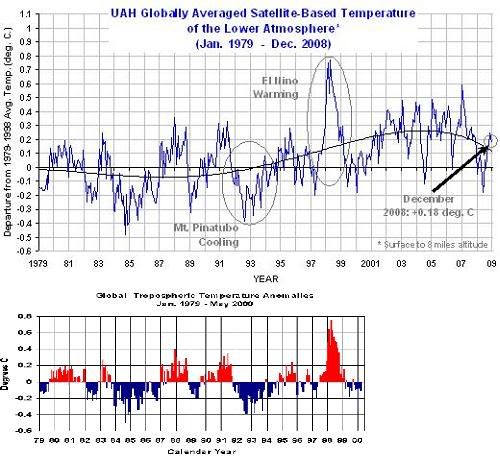
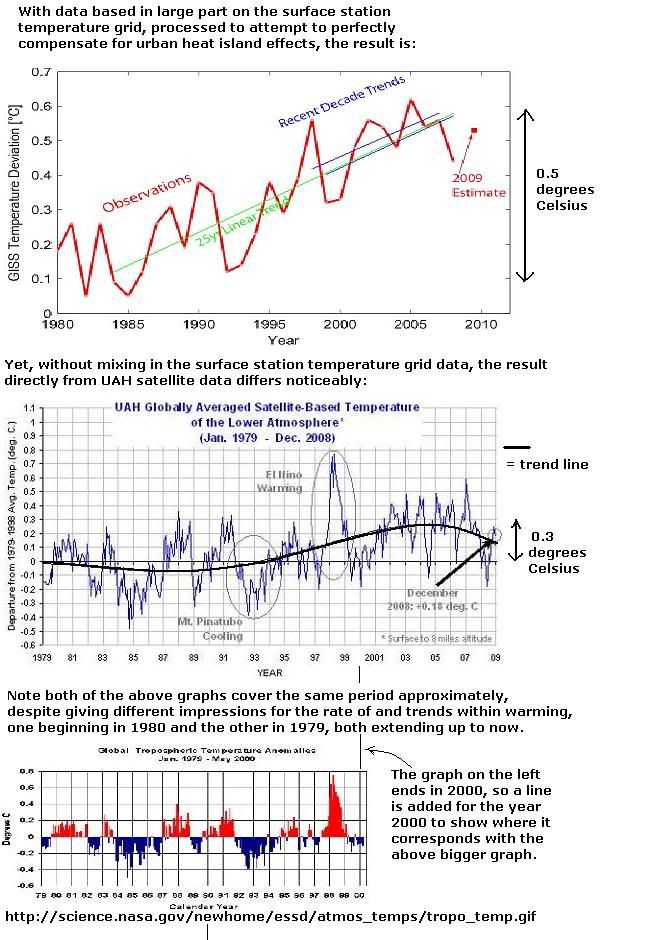
I would love to know what exactly these third party adjustments are since you have provided exactly zero evidence that they occurred.Gilthan wrote:The earlier charts of satellite temperatures are straight from what's currently posted on the NASA website and correspond to what's in such as the recent December 2008 report at http://climate.uah.edu/dec2008.htm where at the bottom it shows global average temperature over the years. They're not out-of-date, and they show a temperature rise over the past 30 years that is overall not more than around 0.2 degrees Celsius. Convenient third-party adjustments would have to be taken with a little dose of skepticism in context.


