Hacked E-mails from Climate Scientists released

N&P: Discuss governments, nations, politics and recent related news here.

Moderators: Alyrium Denryle, Edi, K. A. Pital

Post Reply
User avatar
bobalot
Jedi Council Member
Posts: 1733
Joined: 2008-05-21 06:42am
Location: Sydney, Australia
Contact:

Re: Hacked E-mails from Climate Scientists released

Post by bobalot »

Gilthan wrote:The context in which cbsnews has the quote is the following:

http://www.cbsnews.com/blogs/2009/11/24 ... 1180.shtml
I am very sorry to report that the rest of the databases seem to be in nearly as poor a state as Australia was. There are hundreds if not thousands of pairs of dummy stations, one with no WMO and one with, usually overlapping and with the same station name and very similar coordinates. I know it could be old and new stations, but why such large overlaps if that's the case? Aarrggghhh! There truly is no end in sight... So, we can have a proper result, but only by including a load of garbage!

One thing that's unsettling is that many of the assigned WMo codes for Canadian stations do not return any hits with a web search. Usually the country's met office, or at least the Weather Underground, show up – but for these stations, nothing at all. Makes me wonder if these are long-discontinued, or were even invented somewhere other than Canada!

Knowing how long it takes to debug this suite - the experiment endeth here. The option (like all the anomdtb options) is totally undocumented so we'll never know what we lost. 22. Right, time to stop pussyfooting around the niceties of Tim's labyrinthine software suites - let's have a go at producing CRU TS 3.0! since failing to do that will be the definitive failure of the entire project.

Ulp! I am seriously close to giving up, again. The history of this is so complex that I can't get far enough into it before by head hurts and I have to stop. Each parameter has a tortuous history of manual and semi-automated interventions that I simply cannot just go back to early versions and run the update prog. I could be throwing away all kinds of corrections - to lat/lons, to WMOs (yes!), and more.
Regarding the last sentence, some of the question here is the corrections and adjustments to raw data. Again, this comes back to the big matter here, how such compares to the earlier-graphed satellite data which doesn't go through so many adjustments.
I love this, I point out why one of your sources was a shitty debunked source and the FACT you took a quote out of context AND YOU COMPLETELY IGNORE MY CRITICISM REGARDING THESE ISSUES.

CONCEDE YOU TOOK THE QUOTE OUT OF CONTEXT OR FUCK OFF.

Let's take your latest section, that once again you took out of context. Ian "Harry" Harris vents his frustration of the way the data is organised. He vents ONCE AGAIN about duplicate and overlapping data, which seems to be a continuing problem with merging these databases. No where (despite your implications) does he declare that he will be manipulating the data, which is what you and the rest of your fellow shit sniffers have been implying. All he says is that the problem of organising this data iwill be very complex, not impossible.

All you can imply is that he MIGHT have manipulated the data, which once again is pure speculation. Interestingly enough you picked a section of text (before a whole heap of example data and more venting) just before the END of the files that was illegally hacked from the email server. He could have very well overcome this problem, we simply don't know, we don't know what he did after this.

He has repeatedly described problems as insurmountable, only to overcome them. Since he managed to produce a merged database, I assume he did manage to overcome this problem as well.

Isn't it funny that you picked this particular paragraph to quote? All the other issues he faced he eventually overcame, so you pick a paragraph towards the end of the file, which we don't know the resolution to. How convenient.

He does however state later on (towards the very end).
[quote="Ian "Harry" Harris"]Wrote metacmp.for. It accepts a list of parameter databases (by default, latest.versions.dat) and
compares headers when WMO codes match. If all WMO matches amongst the databases share common
metadata (lat, lon, alt, name, country) then the successful header is written to a file. If,
however, any one of the WMO matches fails on any metadata - even slightly! - the gaggle of
disjointed headers is written to a second file. I know that leeway should be given, particularly
with lats & lons, but as a first stab I just need to know how bad things are. Well, I got that:[/quote]
So he seems to have developed away to organise the data without overly comprising the "to lat/lons, to WMOs (yes!), and more." We don't know what happens after this because there is not much more in the hacked file.

So your implication that he manipulated the data is without a single shred of evidence. What a surprise.

Lets get on to how you put words into my mouth.
Gilthan wrote:Don't tell me that you're trying to argue that global temperature is rising by 0.2 degrees per half-year and going to rise tens of degrees a decade
When did I say or even imply that?. YOU pointed out that the change in temperature over 30 years is 0.2 degrees. I was questioning if that was what the graph really indicated. At no point did I say or even imply that a mere 0.2 degree rise in temperature per year would lead to rises in temperature of tens of degrees.

CONCEDE YOUR STRAWMAN YOU DISHONEST PIECE OF SHIT.
Gilthan wrote:You should look at the overall trend over decades, more so than how it fluctuates up and down over a fraction of year. For instance, if you wanted to cherry-pick a time when it rose by 0.2 degrees in half a year, I could cherry-pick the time on the chart when it dropped by 0.5 degrees in 2004, yet neither of us would be right if we did that.

Such is quite analogous to looking at global versus local data. Sometimes people arguing for large global warming will point to a local temperature record for heat having risen many degrees, and their mirror image among those arguing the opposite will point to a local record for cold temperature having dropped a number of degrees, yet there are always some spots on earth's millions of square miles which deviate from the average trend.
What the fuck does this have to do with the issues that I raised? I pointed out you used a shitty discredited source and you purposely took a quote out of context.
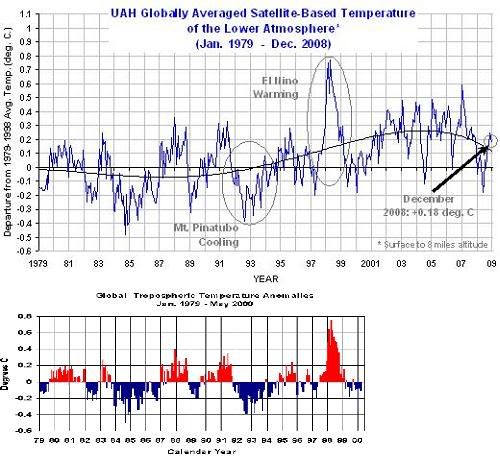
Gilthan wrote:It is far rarer to see the past 8-9 years highlighted in press releases. It doesn't look as good on the graphs, since that's when temperatures started stabilizing or heading down a bit for the time being, at least if looking at the most reliable data of satellite measurements. The upper part of the graph, however, shows it, and the UAH data is still available even if not what most people want to highlight or particularly promote to the press.

Anyway, I'm not saying temperatures won't eventually go back up further, as continuing CO2 emissions do cause some warming, but the satellite data illustrates some limits. Recently we've entered a cool phase of the Pacific Multi-Decadal Oscillation, quadrillions of tons of ocean water moving around having an effect on air temperatures.
So you are saying the last 8-9 years is an anomaly? Since you take such stock in NASA readings.
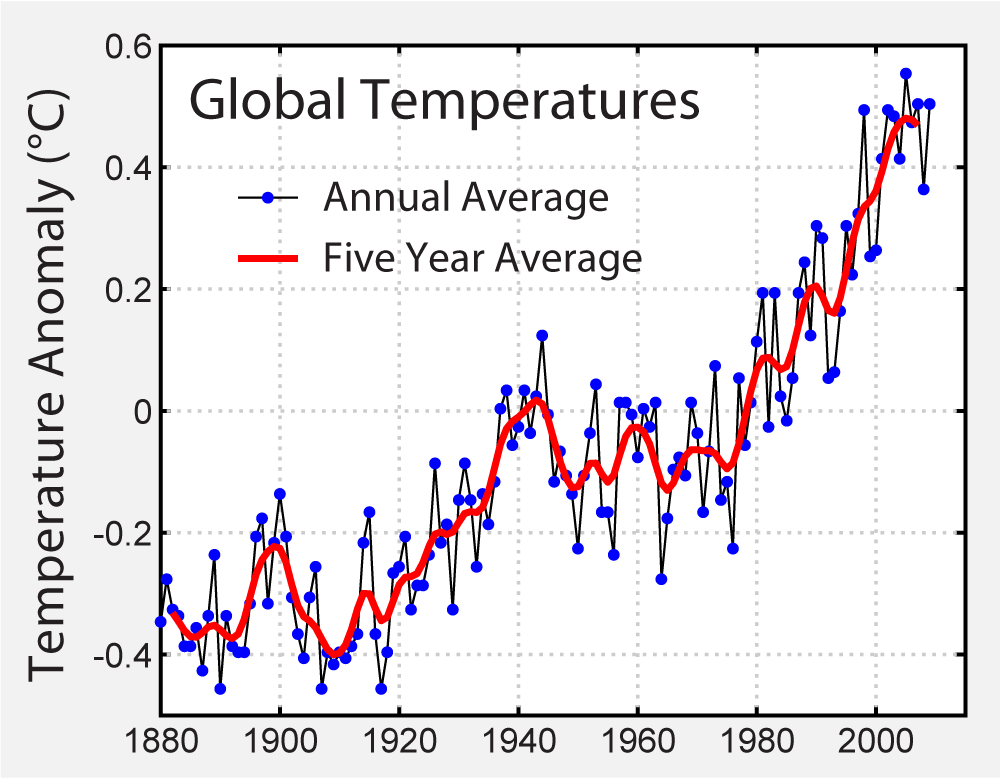
Image
Figure 1, above. (a) Annual surface temperature anomaly relative to 1951-1980 mean, based on surface air measurements at meteorological stations and ship and satellite measurements of sea surface temperature. (b) Global map of surface temperature anomalies for 2007. (Figure also available as large GIF or PDF.)
Source


As for this load of bullshit.
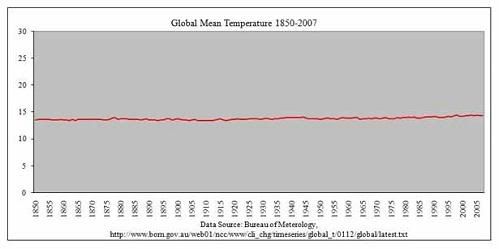
Gilthan wrote: Exactly. The historical mean world temperature in absolute terms is like this, around 14 degrees Celsius:
Image
I followed that link at the bottom of the image and all it shows is this:
185001185012 -0.43
185101185112 -0.29
185201185212 -0.29
185301185312 -0.33
185401185412 -0.29
185501185512 -0.34
185601185612 -0.41
185701185712 -0.49
185801185812 -0.49
185901185912 -0.36
186001186012 -0.39
186101186112 -0.42
186201186212 -0.51
186301186312 -0.33
186401186412 -0.51
186501186512 -0.31
186601186612 -0.31
186701186712 -0.34
186801186812 -0.31
186901186912 -0.31
187001187012 -0.31
187101187112 -0.34
187201187212 -0.28
187301187312 -0.34
187401187412 -0.39
187501187512 -0.41
187601187612 -0.37
187701187712 -0.13
187801187812 -0.01
187901187912 -0.26
188001188012 -0.25
188101188112 -0.25
188201188212 -0.25
188301188312 -0.30
188401188412 -0.37
188501188512 -0.36
188601188612 -0.29
188701188712 -0.38
188801188812 -0.34
188901188912 -0.22
189001189012 -0.42
189101189112 -0.38
189201189212 -0.48
189301189312 -0.51
189401189412 -0.43
189501189512 -0.42
189601189612 -0.23
189701189712 -0.25
189801189812 -0.39
189901189912 -0.31
190001190012 -0.24
190101190112 -0.30
190201190212 -0.43
190301190312 -0.49
190401190412 -0.54
190501190512 -0.42
190601190612 -0.34
190701190712 -0.52
190801190812 -0.55
190901190912 -0.56
191001191012 -0.54
191101191112 -0.56
191201191212 -0.50
191301191312 -0.49
191401191412 -0.32
191501191512 -0.24
191601191612 -0.43
191701191712 -0.50
191801191812 -0.40
191901191912 -0.37
192001192012 -0.33
192101192112 -0.25
192201192212 -0.37
192301192312 -0.34
192401192412 -0.34
192501192512 -0.25
192601192612 -0.16
192701192712 -0.24
192801192812 -0.24
192901192912 -0.35
193001193012 -0.14
193101193112 -0.11
193201193212 -0.14
193301193312 -0.27
193401193412 -0.14
193501193512 -0.17
193601193612 -0.13
193701193712 -0.02
193801193812 0.02
193901193912 0.04
194001194012 0.01
194101194112 0.06
194201194212 -0.01
194301194312 0.01
194401194412 0.12
194501194512 -0.03
194601194612 -0.15
194701194712 -0.18
194801194812 -0.17
194901194912 -0.19
195001195012 -0.28
195101195112 -0.14
195201195212 -0.08
195301195312 -0.02
195401195412 -0.22
195501195512 -0.24
195601195612 -0.33
195701195712 -0.07
195801195812 -0.00
195901195912 -0.06
196001196012 -0.10
196101196112 -0.02
196201196212 -0.01
196301196312 0.01
196401196412 -0.27
196501196512 -0.21
196601196612 -0.14
196701196712 -0.13
196801196812 -0.15
196901196912 -0.03
197001197012 -0.07
197101197112 -0.18
197201197212 -0.08
197301197312 0.05
197401197412 -0.21
197501197512 -0.16
197601197612 -0.25
197701197712 0.01
197801197812 -0.06
197901197912 0.05
198001198012 0.07
198101198112 0.12
198201198212 0.01
198301198312 0.17
198401198412 -0.02
198501198512 -0.04
198601198612 0.03
198701198712 0.18
198801198812 0.18
198901198912 0.11
199001199012 0.25
199101199112 0.20
199201199212 0.07
199301199312 0.10
199401199412 0.17
199501199512 0.28
199601199612 0.14
199701199712 0.35
199801199812 0.53
199901199912 0.31
200001200012 0.28
200101200112 0.41
200201200212 0.46
200301200312 0.47
200401200412 0.45
200501200512 0.48
200601200612 0.43
200701200712 0.41
200801200812 0.34
How the fuck do you get a global mean temperature of 14 degrees from that?

If you had actually bothered to explore the website, you would have found this graph, which is pretty much in line with the NASA graph.
Image

The source that you use is Jennifer Marohasy, an source in Australia that has been repeatedly debunked. She works for a right-wing institute and has absolutely no qualifications in any of the relevant scientific fields related to climatology. Another wonderful source.
Gilthan wrote:Image
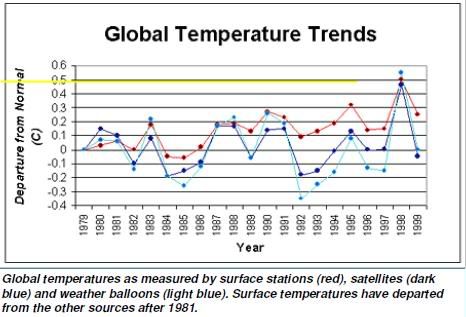
Note that graph ends in 1999, right after the peak of El Nino plus the warming phase of PDO (a time favored by widely-publicized global warming graphs since the effects of those superimposed on top of the lesser long-term global warming trend made it look really rapid), so it doesn't show the subsequent temperature trend best seen by scrolling up a bit to the graph earlier, which rather extends to last year.
Once again you post an image excluding the last 10 years.
Gilthan wrote:A difference between surface temperature stations and satellite measurements is that the latter uniformly more directly measure over the earth's 200 million square miles of surface area. In contrast, the former are primarily concentrated within convenient areas within or nearby cities, not evenly distributed. From a grid of surface temperature stations which has gotten cut back and increasingly sparse over the past couple decades, processing of data is supposed to accurately extrapolate the gaps and the picture for other millions of square miles, but that introduces new complications.

Keep in mind any single surface temperature station's record is meaningless for global temperature trends (and there are plenty of specific local examples I could post, showing anything over the decades from large warming, to no change, to large cooling, depending on the particular square mile out of 200 million chosen).

What matters is only the aggregate resulting from trying to fill in the gaps and correct for other factors.

As a made-up example, if U.S. station XYZ hypothetically fully accurately corrected for the presence of a city 2.4 miles away during the 1980s which expanded to have its outskirts within 0.63 miles distance later, every year making extremely sophisticated corrections ... what about the thousands of other stations down to random Kazakhstan station WNM? (Some even think past 20th-century surface temperature data may be affected by little factors like how reportedly Soviet villages in Siberia got a Vodka benefit if they reported to the government a temperature dropping below -15 degrees Celsius). Remember that such is trying to exactly quantify a subtle trend of a fraction of a degree in an average over decades, when temperatures are going up and down by many degrees due to regionally varying factors all the time.

If merely a single major country's reports averaged at some time in 20th-century history being off by a degree or two in accurate adjustments, that would affect the global average surface temperature record by only a small fraction of a degree, yet small fractions of a degree are what these subtle trends are all about.

In comparative contrast, satellite data is more straightforward and better.
In that long meandering load of bullshit, you fail to post a single source backing up any of your claims. Nobody here is impressed of paragraphs of unsubstantiated claims.
Gilthan wrote:Let's say those creating the adjusted surface station data grid like the CRU group never would hesitate to admit any weaknesses (as anyone who is on web forums much surely knows the usual behavior of 99% of people is to wholeheartedly be unbiased in emotionally-charged debates, never doing a little fudging to make past statements and what their jobs depend upon look better). Let's say they never do anything like refuse to release their raw data in compliance with a freedom of information act, as they know it would stand up perfectly to all scrutiny. Let's say funding by government departments with certain ideological leanings and by environmentalist groups obviously makes them paragons of accuracy compared to the corporate world. After all, similar assumptions were so valid when it came to another case of climate modeling: portrayals of nuclear winter effects.
Post EVIDENCE for what you are implying here or retract this paragraph.
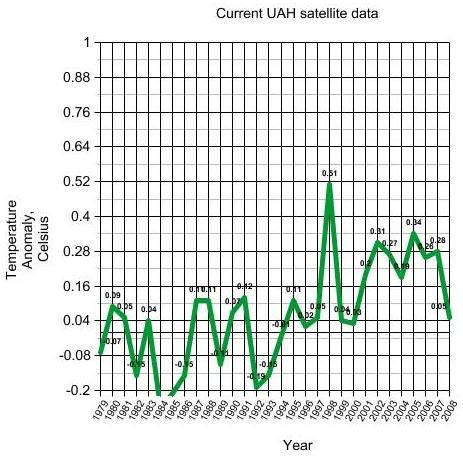
Gilthan wrote:The earlier charts of satellite temperatures are straight from what's currently posted on the NASA website and correspond to what's in such as the recent December 2008 report at http://climate.uah.edu/dec2008.htm where at the bottom it shows global average temperature over the years. They're not out-of-date, and they show a temperature rise over the past 30 years that is overall not more than around 0.2 degrees Celsius. Convenient third-party adjustments would have to be taken with a little dose of skepticism in context.
I would love to know what exactly these third party adjustments are since you have provided exactly zero evidence that they occurred.
"This statement, in its utterly clueless hubristic stupidity, cannot be improved upon. I merely quote it in admiration of its perfection." - Garibaldi

"Problem is, while the Germans have had many mea culpas and quite painfully dealt with their history, the South is still hellbent on painting themselves as the real victims. It gives them a special place in the history of assholes" - Covenant

"Over three million died fighting for the emperor, but when the war was over he pretended it was not his responsibility. What kind of man does that?'' - Saburo Sakai

Join SDN on Discord
User avatar
D.Turtle
Jedi Council Member
Posts: 1909
Joined: 2002-07-26 08:08am
Location: Bochum, Germany

Re: Hacked E-mails from Climate Scientists released

Post by D.Turtle »

Here is a relevant Interview with Michael Mann on Dailykos.com (links and so at the source):
Dailykos.com wrote:Michael Mann Responds to CRU Hack
by DarkSyde
Digg this! Share this on Twitter - Michael Mann Responds to CRU Hack
Thu Nov 26, 2009 at 02:30:04 PM PST

Rush Limbaugh says the climate scientists should be 'drawn and quartered'. Glenn Beck touts stolen emails as evidence for a 'scam,' and the Moonie Times says, well who the hell cares. The Moonies are down to 45,000 uber-wingnut subscribers. Last week we explained the story behind one of the stolen emails. Paleo-climatologist Micheal Mann of Realclimate, who was intimately involved in the issue discussed in some of the emails in question, was kind enough to take time out of his holiday week to provide further clarification.

DS: When Phil Jones wrote in 1999, "I've just completed Mike's Nature trick of adding in the real temps to each series for the last 20 years (i. e. from 1981 onwards) and from 1961 for Keith's to hide the decline," what did he mean?

Michael Mann: Phil Jones has publicly gone on record indicating that he was using the term "trick" in the sense often used by people, as in "bag of tricks", or "a trick to solving this problem ...", or "trick of the trade". In referring to our 1998 Nature article, he was pointing out simply the following: our proxy record ended in 1980 (when the proxy data set we were using terminates) so, it didn't include the warming of the past two decades. In our Nature article we therefore also showed the post-1980 instrumental data that was then available through 1995, so that the reconstruction could be viewed in the context of recent instrumental temperatures. The separate curves for the reconstructed temperature series and for the instrumental data were clearly labeled.

The reference to "hide the decline" is referring to work that I am not directly associated with, but instead work by Keith Briffa and colleagues. The "decline" refers to a well-known decline in the response of only a certain type of tree-ring data (high-latitude tree-ring density measurements collected by Briffa and colleagues) to temperatures after about 1960. In their original article in Nature in 1998, Briffa and colleagues are very clear that the post-1960 data in their tree-ring dataset should not be used in reconstructing temperatures due to a problem known as the "divergence problem" where their tree-ring data decline in their response to warming temperatures after about 1960. "Hide" was therefore a poor word choice, since the existence of this decline, and the reason not to use the post 1960 data because of it, was not only known, but was indeed the point emphasized in the original Briffa et al Nature article. There is a summary of that article available on this NOAA site.

There have been many articles since then trying to understand the reason for this problem, which applies largely to only one very specific type of proxy data (tree-ring wood density data from higher latitudes).

As for my research in this area more generally, there was a study commissioned by the National Academies of Science back in 2006 to assess the validity of paleoclimate reconstructions in general, and my own work in specific. A summary of that report, and link to it, is available here. And the New York Times (6/22/06), in an article about the report entitled "Science Panel Backs Study on Warming Climate" had the following things to say:

A controversial paper asserting that recent warming in the Northern Hemisphere was probably unrivaled for 1,000 years was endorsed today, with a few reservations, by a panel convened by the nation's preeminent scientific body...At a news conference at the headquarters of the National Academies, several members of the panel reviewing the study said they saw no sign that its authors had intentionally chosen data sets or methods to get a desired result. "I saw nothing that spoke to me of any manipulation," said one member, Peter Bloomfield, a statistics professor at North Carolina State University. He added that his impression was the study was "an honest attempt to construct a data analysis procedure."

DS: You wrote, "Perhaps we'll do a simple update to the Yamal post. As we all know, this isn't about truth at all, its about plausibly deniable accusations," what's the story there?

MM: This refers to a particular tree-ring reconstruction of Keith Briffa’s. These tree-ring data are just one of numerous tree-ring records used to reconstruct past climate. Briffa and collaborators were criticized (unfairly in the view of many of my colleagues and me) by a contrarian climate change website based on what we felt to be a misrepresentation of their work. A further discussion can be found on the site "RealClimate.org" that I co-founded and help run. It is quite clear from the context of my comments that what I was saying was that the attacks against Briffa and colleagues were not about truth but instead about making plausibly deniable accusations against him and his colleagues.

We attempted to correct the misrepresentations of Keith's work in the "RealClimate article mentioned above, and we invited him and his co-author Tim Osborn to participate actively in responding to any issues raised in the comment thread of the article which he did.

DS: Phil Jones again wrote "Can you delete any emails you may have had with Keith re AR4? Keith will do likewise. He's not in at the moment -minor family crisis. Can you also email Gene and get him to do the same? I don't have his new email address. We will be getting Caspar to do likewise."

MM: This was simply an email that was sent to me, and can in no way be taken to indicate approval of, let alone compliance with, the request. I did not delete any such email correspondences.

DS: You wrote, "I think we have to stop considering Climate Research as a legitimate peer-reviewed journal. Perhaps we should encourage our colleagues in the climate research community to no longer submit to, or cite papers in, this journal"?

MM: This comment was in response to a very specific incident regarding a paper by Soon and Baliunas published in the journal "Climate Research". An editor of the journal, with rather contrarian views on climate change, appeared to several of us to be gaming the system to let through papers that clearly did not meet the standards of quality for the journal. The chief editor (Hans von Storch), and half of the editorial board, resigned in protest of the publication of the paper, after the publisher refused to allow von Storch the opportunity to write an editorial about how the peer review process had failed in this instance.

Please see e.g. this post at RealClimate. Especially the 3rd bullet item -- see the various links, which lead to letters from chief editor Von Storch, and an article by the journalist Chris Mooney about the incident.

Scientists all choose journals in which we publish and we all recommend to each other and our students which journals they should publish in. People are free to publish wherever they can and are free to recommend some journals over others. For an example of this behavior in daily life, people make choices and recommendations all the time in their purchasing habits. It is highly unusual for a chief editor and half of an editorial board to resign and that indicates a journal in turmoil that should possibly be avoided. Similarly, authors are allowed to cite any papers they want, although usually the editor will note incorrect or insufficient citing.

I support the publication of "skeptical" papers that meet the basic standards of scientific quality and merit. I myself have published scientific work that has been considered by some as representing a skeptical point of view on matters relating to climate change (for example, my work demonstrating the importance of natural oscillations of the climate on multidecadal timescales). Skepticism in the truest scientific sense of the word is good and is indeed essential to science. Skepticism should not be confused, however, with contrarianism that does not meet the basic standards of scientific inquiry.

DS: "It would be nice to try to contain the putative "MWP".

MM: In this email, I was discussing the importance of extending paleoclimate reconstructions far enough back in time that we could determine the onset and duration of the putative "Medieval Warm Period". Since this describes an interval in time, it has to have both a beginning and end. But reconstructions that only go back 1000 years, as most reconstructions did at the time, didn't reach far enough back to isolate the beginning of this period, i.e. they are not long enough to "contain" the interval in question. In more recent work, such as the IPCC Fourth Assessment Report published in 2007, the paleoclimate reconstructions stretch nearly 2000 years back in time, which is indeed far enough back in time to "contain" or "isolate" this period in time.
So far the only thing I've seen that is bad is the EMail discussing deleting stuff in case a FOIA request comes in. Everything else has been addressed multiple times at Realclimate.org. If you are really interested in seeing explanations of the various stuff (beyond what is posted at the top of that post), just read through the inline commments of Gavin in that thread and the previous one. Though after a short time most of it is repetition, because somehow all these independent skeptics independently find the same so-called controversial emails.

Oh, and because the same idiots keep crowing about the data and the source code:

HERE is the data used in the Goddard Institute for Space Studies GCM models, whose source code can be found HERE.

Not that it will shut the idiots up.
User avatar
Guardsman Bass
Cowardly Codfish
Posts: 9281
Joined: 2002-07-07 12:01am
Location: Beneath the Deepest Sea

Re: Hacked E-mails from Climate Scientists released

Post by Guardsman Bass »

So far the only thing I've seen that is bad is the EMail discussing deleting stuff in case a FOIA request comes in.
That was definitely a mistake on Phil Jones' part, but understand that he was in a bind - part of the data he had came from various sources (such as National Meteorological Offices) on the condition that he not release it himself. Had he gone ahead and done so, many of those folks would not have lent him their data in the future. That's part of the reason, by the way, for a series of rejected FOI requests regarding the data going back to 2007.

Here's an explanation from Halldor Bjornsson of the Icelandic Met. Service :
Re: CRU data accessibility.

National Meteorological Services (NMSs) have different rules on data exchange. The World Meteorological Organization (WMO) organizes the exchange of “basic data”, i.e. data that are needed for weather forecasts. For details on these see WMO resolution number 40 (see http://bit.ly/8jOjX1).

This document acknowledges that WMO member states can place restrictions on the dissemination of data to third parties “for reasons such as national laws or costs of production”. These restrictions are only supposed to apply to commercial use, the research and education community is supposed to have free access to all the data.

Now, for researchers this sounds open and fine. In practice it hasn’t proved to be so.

Most NMSs also can distribute all sorts of data that are classified as “additional data and products”. Restrictions can be placed on these. These special data and products (which can range from regular weather data from a specific station to maps of rain intensity based on satellite and radar data). Many nations do place restrictions on such data (see link for additional data on above WMO-40 webpage for details).

The reasons for restricting access is often commercial, NMSs are often required by law to have substantial income from commercial sources, in other cases it can be for national security reasons, but in many cases (in my experience) the reasons simply seem to be “because we can”.

What has this got to do with CRU? The data that CRU needs for their data base comes from entities that restrict access to much of their data. And even better, since the UK has submitted an exception for additional data, some nations that otherwise would provide data without question will not provide data to the UK. I know this from experience, since my nation (Iceland) did send in such conditions and for years I had problem getting certain data from the US.

The ideal, that all data should be free and open is unfortunately not adhered to by a large portion of the meteorological community. Probably only a small portion of the CRU data is “locked” but the end effect is that all their data becomes closed. It is not their fault, and I am sure that they dislike them as much as any other researcher who has tried to get access to all data from stations in region X in country Y.

These restrictions end up by wasting resources and hurting everyone. The research community (CRU included) and the public are the victims. If you don’t like it, write to you NMSs and urge them to open all their data.
I posted this over at HPCA too, but I doubt it will have much impact amidst a sea of right-wing crow.
“It is possible to commit no mistakes and still lose. That is not a weakness. That is life.”
-Jean-Luc Picard


"Men are afraid that women will laugh at them. Women are afraid that men will kill them."
-Margaret Atwood
User avatar
D.Turtle
Jedi Council Member
Posts: 1909
Joined: 2002-07-26 08:08am
Location: Bochum, Germany

Re: Hacked E-mails from Climate Scientists released

Post by D.Turtle »

Guardsman Bass wrote:That was definitely a mistake on Phil Jones' part, but understand that he was in a bind - part of the data he had came from various sources (such as National Meteorological Offices) on the condition that he not release it himself. Had he gone ahead and done so, many of those folks would not have lent him their data in the future. That's part of the reason, by the way, for a series of rejected FOI requests regarding the data going back to 2007.
As far as I understood, the E-Mail requesting deletion of some other E-Mails was not related to the officialy denied FOI requests concerning their data from the NMS, which, as you posted, they can't release because of various agreements.
I posted this over at HPCA too, but I doubt it will have much impact amidst a sea of right-wing crow.
My impression is that most of the people here view the people on HPCA as right-wing hacks far separated from reality, while they view us as left-wing hacks far separated from reality. Probably the only thing that both boards more or less agree on, politically, is that the economic policy of Obama is a mess.

As far as I am concerned, they are a good source for information on military hardware - everything else, not so much.

But I do like Stuart's stories. :)
User avatar
Guardsman Bass
Cowardly Codfish
Posts: 9281
Joined: 2002-07-07 12:01am
Location: Beneath the Deepest Sea

Re: Hacked E-mails from Climate Scientists released

Post by Guardsman Bass »

D.Turtle wrote:
Guardsman Bass wrote:That was definitely a mistake on Phil Jones' part, but understand that he was in a bind - part of the data he had came from various sources (such as National Meteorological Offices) on the condition that he not release it himself. Had he gone ahead and done so, many of those folks would not have lent him their data in the future. That's part of the reason, by the way, for a series of rejected FOI requests regarding the data going back to 2007.
As far as I understood, the E-Mail requesting deletion of some other E-Mails was not related to the officialy denied FOI requests concerning their data from the NMS, which, as you posted, they can't release because of various agreements.
Really? I thought the request for deletion was in response to the threat of an FOI request. My bad - it looks like Jones just really fucked up, or is otherwise somewhat secretive.
“It is possible to commit no mistakes and still lose. That is not a weakness. That is life.”
-Jean-Luc Picard


"Men are afraid that women will laugh at them. Women are afraid that men will kill them."
-Margaret Atwood
Gilthan
Youngling
Posts: 88
Joined: 2009-11-06 07:07am

Re: Hacked E-mails from Climate Scientists released

Post by Gilthan »

First, a highlight for comedy value:
bobalot wrote:As for this load of bullshit.
Gilthan wrote:Exactly. The historical mean world temperature in absolute terms is like this, around 14 degrees Celsius:

Image
<snip>

How the fuck do you get a global mean temperature of 14 degrees from that?
How dare I suggest global average temperature is 14° Celsius (57° Fahrenheit)?!? How outrageous, unbelievable, and controversial!

What did you think it was, 100 degrees? Seriously, read the graph.

Of course I could throw in other references, like this:

http://www.dnr.mo.gov/energy/cc/cc5.htm
We are living in an abnormally cool period since the earth's average surface temperature for most of its history averaged 22 Celsius compared to the present 14 Celsius.
A quick diversion to the other graph reading issue, this:
bobalot wrote:YOU pointed out that the change in temperature over 30 years is 0.2 degrees. I was questioning if that was what the graph really indicated. At no point did I say or even imply that a mere 0.2 degree rise in temperature per year would lead to rises in temperature of tens of degrees.
I'm not here to try to determine all possible meanings of your usual brilliant insights in response to the graph:
bobalot wrote:
Gilthan wrote:Image

That's only a very small temperature change, yet it is the result of the most straightforward data set.

Your graph shows 1.8 degrees Fahrenheit temperature rise among certain temperature stations in U.S. cities over the past 30 years (not that U.S. temperatures are much of an indicator of the other 98% of the world's surface area). Mine is from satellites directly measuring low-altitude air temperatures with a lot less layers of uncertainty. It shows a much lesser rate of world temperature rise, 0.2 degrees Celsius or less overall over that time period.
Hey guys, correct me if I'm wrong, isn't this is the change in temperature over time, wouldn't that mean that change of 0.2 degrees would be over that little section of time (mid 2009-2009), not over 30 years?

I'm assuming this is like an acceleration graph. For example,

Time Period 1: 1m/s/s
Time Period 2: 2m/s/s
Time Period 3: 1m/s/s
Time Period 4: -1m/s/s

The average acceleration over the entire length wouldn't be -1m/s/s.
Now, onto other parts:
bobalot wrote:CONCEDE YOU TOOK THE QUOTE OUT OF CONTEXT OR FUCK OFF.
Somewhat out of context.

The "load of garbage" phrase itself was in the following context:

http://www.anenglishmanscastle.com/HARRY_READ_ME.txt
A bigger problem was the inclusion of strings of consecutive, identical values (for cloud and/or dtr). Not sure what the source is, as they are not == to the climatology <snip>

As can be seen, neither the dtr (left) nor the cloud (right) look 'sensible', even as anomalies. Several other months in lat band #19 are either nan or -999 (count=0).

However, if we push the duplicates limit up to, say, 20, we get:

<snip>

So, we can have a proper result, but only by including a load of garbage! In fact, I might print out this cell as an example. Let's see:

<snip>

This 'looks' better - not so steep, and the intercept is a shade closer to 0.
The impression I had from the CBS news article was off to a degree, as the "load of garbage" sentence turns out to be outside of direct context to the rest of what they quoted.

However, an extremely top quality database would be needed to adjust for urban heat island effects accurately, with a lot of work done on each station to avoid the small fraction of a degree errors which would screw up the whole result. Factors like urban sprawl vary over the decades.

Yet instead the quality of the database and the amount of work done per temperature station is such that not even the basic descriptor codes can be gotten right, as illustrated in part of the CBS news quote. The following is well after the "garbage" phrase but also deserves the term:
I am very sorry to report that the rest of the databases seem to be in nearly as poor a state as Australia was. There are hundreds if not thousands of pairs of dummy stations, one with no WMO and one with, usually overlapping and with the same station name and very similar coordinates. I know it could be old and new stations, but why such large overlaps if that's the case? Aarrggghhh! There truly is no end in sight... So, we can have a proper result, but only by including a load of garbage!

One thing that's unsettling is that many of the assigned WMo codes for Canadian stations do not return any hits with a web search. Usually the country's met office, or at least the Weather Underground, show up – but for these stations, nothing at all. Makes me wonder if these are long-discontinued, or were even invented somewhere other than Canada!
http://www.cbsnews.com/blogs/2009/11/24 ... 1180.shtml
bobalot wrote:Since you take such stock in NASA readings.
Image
Figure 1, above. (a) Annual surface temperature anomaly relative to 1951-1980 mean, based on surface air measurements at meteorological stations and ship and satellite measurements of sea surface temperature. (b) Global map of surface temperature anomalies for 2007. (Figure also available as large GIF or PDF.)
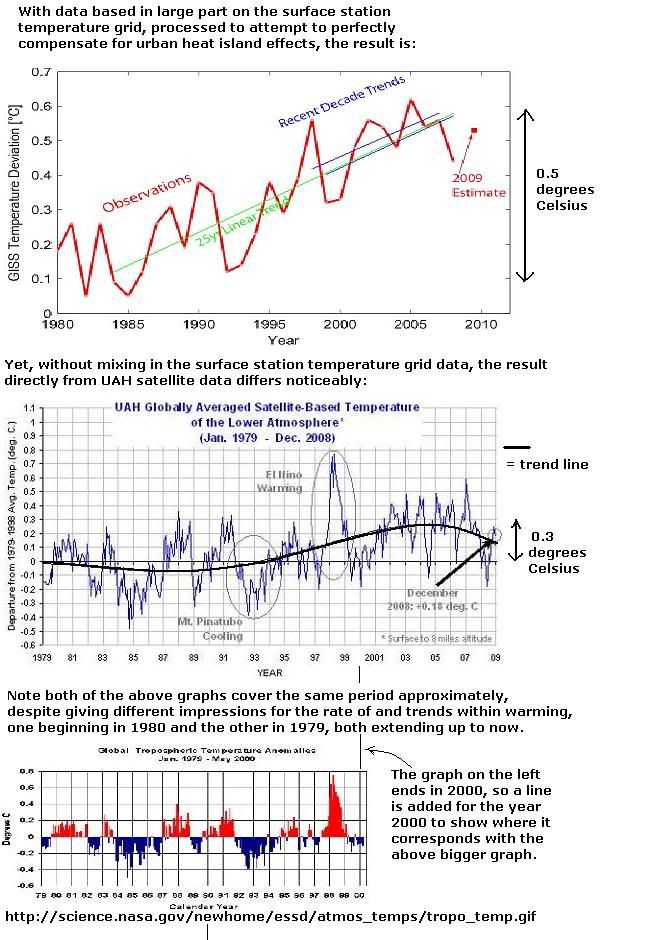
Mixing in (primarily) the surface station grid data makes it give a different result than from satellites alone.

At another NASA website, at http://science.nasa.gov/newhome/essd/at ... o_temp.gif, can be seen the satellite lower atmosphere air temperature measurements:

Image

That, of course, is the inset in the earlier displayed graph showing the trend up through recent years after 2000:

Image

Fundamentally, a distinction must be made between the satellite measured tropospheric temperature trend, versus surface station grid temperature trends.

The latter come after CRU / other groups do computational adjustments attempting to compensate for such as the disproportionate concentration of surface temperature stations around population centers and urban heat island effects (to whatever extent they actually do attempt such). Those extremely tricky, complex, adjustments would require precise, near-perfect organization to not get the small fraction of a degree per decade trend of global warming overwhelmed by the multiple degrees from local factors.

You sure see suggestion of an effort that well organized at http://www.anenglishmanscastle.com/HARRY_READ_ME.txt alright!

Real science is based on reproducible results and independent criticism, not the head of a body saying he would delete surface station grid raw data rather than let others see it:
An email sent by one of Prof Jones's colleagues said: "The fact is that we can't account for the lack of warming at the moment and it is a travesty that we can't."

Prof Jones, whose department has for years refused to release its raw data on temperatures, wrote another email in which he said sceptics "have been after the CRU station data for years. If they ever hear there is a Freedom of Information Act now in the UK, I think I'll delete the file rather than send it to anyone". By chance, he now admits he has "accidentally" deleted some of the raw data.

<snip>

The CRU has the largest archive of global temperature data in the world, and its research formed the basis of the United Nations' key document on global warming, the Intergovernmental Panel on Climate Change report of 2007.

But Prof Jones has been embroiled in controversy before. Three years ago, a report commissioned by the US House of Representatives energy and commerce committee claimed that a clique of just 43 scientists, including Prof Jones and one of his CRU colleagues, was stifling open debate on climate change.
http://www.telegraph.co.uk/earth/copenh ... egate.html

Whether the excuses for refusing to release the CRU surface station temperature data are viewed by someone as valid or not, it could use outside examination.
User avatar
D.Turtle
Jedi Council Member
Posts: 1909
Joined: 2002-07-26 08:08am
Location: Bochum, Germany

Re: Hacked E-mails from Climate Scientists released

Post by D.Turtle »

Its funny how all of the skeptics are bouncing around with the Harry_readme file as if that file invalidates everything ever done in climate science, when it is about one data set, and an effort to merge different databases into one coherent set.

The question is: If all the data from CRU was removed, would that change anything about AGW?

The answer is no, because there are many independent data sources, reconstructions, models, etc. The fact of AGW is not dependent on one little research unit in the UK.

In effect, what do the hacked emails change in regards to these 6 steps (taken from Realclimate.org:

Step 1: There is a natural greenhouse effect.
Step 2: Trace gases contribute to the natural greenhouse effect.
Step 3: The trace greenhouse gases have increased markedly due to human emissions
Step 4: Radiative forcing is a useful diagnostic and can easily be calculated
Step 5: Climate sensitivity is around 3ºC for a doubling of CO2
Step 6: Radiative forcing x climate sensitivity is a significant number

The answer is nothing.

Oh, and and HERE is new page put up at Realclimate with a few links to various data sources, including the source code of various models used in the IPCC reports, raw and processed data sources, paleoclimate reconstructions etc.

There is your fucking data, not that you are competent enough to use it ...

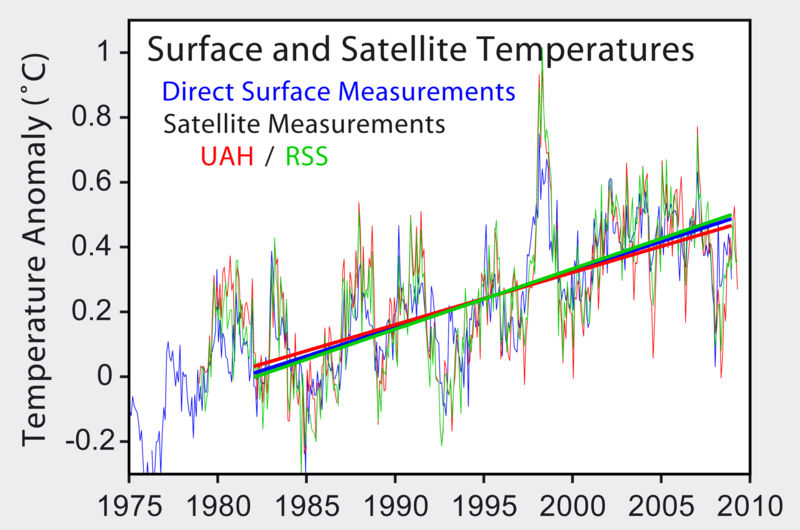
Oh, and about that picture of Satellite-Based Temperatures, why don't you use one that shows a linear approximation:

Image
Could that be a very similar trend between satellite and surface temperature measurements? Nah ...
User avatar
Starglider
Miles Dyson
Posts: 8709
Joined: 2007-04-05 09:44pm
Location: Isle of Dogs
Contact:

Re: Hacked E-mails from Climate Scientists released

Post by Starglider »

D.Turtle wrote:Its funny how all of the skeptics are bouncing around with the Harry_readme file as if that file invalidates everything ever done in climate science, when it is about one data set, and an effort to merge different databases into one coherent set.
The response to this information is being treated politically rather than scientifically, and the standard approach for uneducated political hacks is to scream about as many things as possible and hope something sticks. We see this more often with the right wingers than the left wing in the US, but that's just because the US is a right wing country. There are still plenty of eco-nuts spewing absolutely every complaint they can think of (real or imagined) about industrial civilisation, and in Europe we have hordes of socialists spewing crap about the G8, big business etc. Note that both this thread and the HPCA thread mentioned above are in the 'news and politics' sections of their respective boards, not 'science and technology'. This is understandable, but unfortunate in that the exaggerations obscure and devalue the real problems.

Anyway, as I've said the real problem here is a horribly broken and bodged model that would not stand up to open peer review - and the institutional attitude that considered this 'fit to publish'. Frankly I can't really blame people for getting political about this, because the climate 'scientists' (I hesitate to use the word for this bunch) deliberately threw themselves into the political realm with this inadequate supporting work, then refused to either release it or clean it up. From what I can tell, their budget easily suffices to hire one or two good programmers, who could go through the prototype and rewrite it in 'literate programming' fashion, with everything clearly derived and explained. Preferably dumping the voodoo orthodox stats and replacing them with proper peer-verifiable Bayesian ones. Having this in the public domain, carefully reviewed and approved by a diverse panel of experts, should be the minimum standard for basing such sweeping public policy on.

Whining about how this is 'too hard' is pathetic; it is not 'too hard' for properly qualified staff and if they didn't have such staff, they should have hired them. If they did not have the funds, they should have said so; 'interesting preliminary results, more funds vitally needed to clean up the model'. As far as I can tell they did have enough funds, and I can only assume the CRU chose to blow all their funding on PR junkets and week-long conferences in popular holiday resorts instead.
The question is: If all the data from CRU was removed, would that change anything about AGW?
No, the question is, can this be treated as a representative sample of the antics going on at similar organisations? Until someone comes up with counterexamples (e.g. a similar AGW-supporting model that is clearly explained, well written and fully published), I would have to say yes. Even if not, the utterly sloppiness, contempt for the scientific method and dishonesty in the presentation of results that the CRU seems to have shown has damaged the whole field of climate science, and that is just another reason why the involved parties should be fired.
User avatar
MKSheppard
Ruthless Genocidal Warmonger
Posts: 29842
Joined: 2002-07-06 06:34pm

Re: Hacked E-mails from Climate Scientists released

Post by MKSheppard »

Starglider wrote:No, the question is, can this be treated as a representative sample of the antics going on at similar organisations?
I've heard rumblings that there may be similar issues in New Zealand. This doesn't bode well for the current crop of Climate Scientists, if all of them are using horribly dodgy models.
"If scientists and inventors who develop disease cures and useful technologies don't get lifetime royalties, I'd like to know what fucking rationale you have for some guy getting lifetime royalties for writing an episode of Full House." - Mike Wong

"The present air situation in the Pacific is entirely the result of fighting a fifth rate air power." - U.S. Navy Memo - 24 July 1944
User avatar
Fingolfin_Noldor
Emperor's Hand
Posts: 11834
Joined: 2006-05-15 10:36am
Location: At the Helm of the HAB Star Dreadnaught Star Fist

Re: Hacked E-mails from Climate Scientists released

Post by Fingolfin_Noldor »

Climate modeling is something of a fudge Science, because there are a thousand and one variables to take into account. From the Sun's radiation, to the water flow, to God Knows how much more. It should not be surprising that a system this complex is going to run into lots of problems.

Mind you, the same problem is afflicting much of astrophysics and cosmology. There are tonnes of papers in the arxiv archives where people just simply post up their latest postulations, models, assumptions etc. If all these were to be published, there would be tonnes of books about them.
Image
STGOD: Byzantine Empire
Your spirit, diseased as it is, refuses to allow you to give up, no matter what threats you face... and whatever wreckage you leave behind you.
Kreia
User avatar
Starglider
Miles Dyson
Posts: 8709
Joined: 2007-04-05 09:44pm
Location: Isle of Dogs
Contact:

Re: Hacked E-mails from Climate Scientists released

Post by Starglider »

Fingolfin_Noldor wrote:Climate modeling is something of a fudge Science, because there are a thousand and one variables to take into account.
Lots of variables does not mean you apply arbitrary transforms and corrections all over the place, use highly dubious statistical smoothing for no good reason, then refuse to publish your code. Many scientific and engineering endeavours rely on complex computer models without a complete theoretical basis - nuclear weapon modelling is a particularly hard one - yet they work reasonably well and are not built out of swiss-cheese crap.
From the Sun's radiation, to the water flow, to God Knows how much more. It should not be surprising that a system this complex is going to run into lots of problems.
Shep already illustrated this with the nuclear winter problem; all of this can be carefully considered and added in, in a peer-reviewable fashion, given the will to do so. The will to do so does not seem to exist at the CRU and apparently many of its peers - they consider 'job done' as soon as the system spits out a graph showing significant warming (where 'significant' is defined as 'enough to get politicians to listen to us and give us more funding').
Mind you, the same problem is afflicting much of astrophysics and cosmology.
Which are not the basis of economic policy affecting billions (or an opportunity for large scale scams as carbon trading is) and thus not held to the same standards of completeness. Cosmologists admit that their hairy models are highly speculative, and eagerly await further data to clean them up. The CRU apparently considers their model complete and actively rejects further data if it is in danger of contradicting their 'indisputable findings'.
User avatar
Fingolfin_Noldor
Emperor's Hand
Posts: 11834
Joined: 2006-05-15 10:36am
Location: At the Helm of the HAB Star Dreadnaught Star Fist

Re: Hacked E-mails from Climate Scientists released

Post by Fingolfin_Noldor »

Starglider wrote:Lots of variables does not mean you apply arbitrary transforms and corrections all over the place, use highly dubious statistical smoothing for no good reason, then refuse to publish your code. Many scientific and engineering endeavours rely on complex computer models without a complete theoretical basis - nuclear weapon modelling is a particularly hard one - yet they work reasonably well and are not built out of swiss-cheese crap.
What? I'm hardly not even defending these idiots. I have known people who spend their life times working on heat flow equations, and they only get close approximate answers. Let's not talk about a system that is infinitesimally more complicated than that and people who make fantastical claims about that.
Image
STGOD: Byzantine Empire
Your spirit, diseased as it is, refuses to allow you to give up, no matter what threats you face... and whatever wreckage you leave behind you.
Kreia
Gilthan
Youngling
Posts: 88
Joined: 2009-11-06 07:07am

Re: Hacked E-mails from Climate Scientists released

Post by Gilthan »

D.Turtle wrote:Oh, and about that picture of Satellite-Based Temperatures, why don't you use one that shows a linear approximation:

[img<snip>]http://upload.wikimedia.org/wikipedia/c ... atures.png[/img]
Could that be a very similar trend between satellite and surface temperature measurements? Nah ...
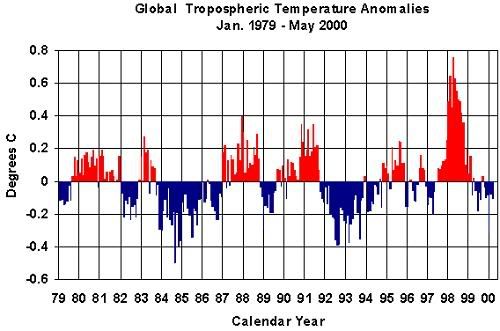
Despite claiming to mix in UAH data, they modify the satellite data to make that graph, as current data at the UAH site (http://climate.uah.edu/dec2008.htm) can be compared in contrast:

Image

The graph isn't fancy, as I need to reinstall Excel on this computer after the reformat, but the data comes from the bottom of http://climate.uah.edu/dec2008.htm directly.

They make adjusted graphs which make their surface temperature data look good, but they can't just use the current up-to-date satellite data without modifying it, or else the result is like the above graph...

As previously discussed, the surface station temperature grid has to be subject to countless complex adjustments to not get a tenth of a degree error or anything from not adjusting fully for the uneven distribution of the temperature sensors. The questionable quality of what we've seen isn't inspiring confidence in the overall perfection of all those adjustments to the worldwide surface station database, which is hence why I like to see the trends within satellite data itself in comparison.
If all the data from CRU was removed, would that change anything about AGW?
They have the largest archive of global surface temperature data in the world (although, as the news article of the last quote in my prior post mentioned, their head Prof. Jones not only refuses to release the surface station data but also "accidentally" deleted some of that raw data). The global surface station data would be affected. The UAH satellite data with its different, lesser trend shown? Not so much.
D.Turtle wrote:The answer is no, because there are many independent data sources, reconstructions, models, etc. The fact of AGW is not dependent on one little research unit in the UK.
To assume either AGW doesn't exist at all or it corresponds to the more extreme assumptions is just a simplistic strawman. As pointed out a dozen times before in this thread, there can be debate whether temperature rise is more like the curve in the satellite tropospheric measurements, with on the order of 0.2 degrees Celsius global warming over the past 30 years, or rather it has been the higher temperature increase and different trend from the surface station grid. (Obviously CO2 has a warming effect in itself, that part being basic physics, but whether feedback with water vapor amplifies its relatively moderate direct effects as much as the most widely publicized models assume is more debatable).

A good site on this matter is the following climatologist and former head NASA project leader's info:

http://www.drroyspencer.com/
3. The appeal to peer-reviewed and published research. I could go on about this for pages. Yes, it is important to have scientific research peer-reviewed and published. But as the Climategate e-mails have now exposed (and what many scientists already knew), we skeptics of human-caused climate change have “peers” out there who have taken it upon themselves to block our research from being published whenever possible. We know there are editors of scientific journals who assist in this by sending our papers to these gatekeepers for the purpose of killing the paper. We try not to complain too much when it happens because it is difficult to prove motivation. I believe the day is approaching when it will be time to make public the evidence of biased peer review.

4. Appeal to authority. This is the last refuge of IPCC scientists. Even when we skeptics get research published, it is claimed that our research is contradicted by other research the IPCC has encouraged, helped to get funded, and cherry-picked to support its case. This is dangerous for the progress of science. If the majority opinion of scientists was always assumed to be correct, then most major scientific advances would not have occurred. The appeal to authority is also a standard propaganda technique.

5. Unwillingness to debate. I have lectured to many groups where the organizers could not find anyone from the IPCC side who would present the IPCC’s side of the story. I would be happy to debate any of the IPCC experts on the central issues of human-caused versus natural climate change, and feedbacks in the climate system. They know where to find me. (For the most common tactic used by the IPCC in a debate, see annoyance #4.)

6. A lack of common sense. Common sense can be misleading, of course. But when there is considerable uncertainty, sometimes it is helpful to go ahead and use a little anyway. Example: It is well known that the net effect of clouds is to cool the Earth in response to radiant heating by the sun. But when it comes to global warming, all climate models do just the opposite…change clouds in ways that amplify radiative warming. While this is theoretically possible, it is critical to future projections of global warming that the reasons why models do this be thoroughly understood. Don’t believe it just because group think within the climate modeling community has decided it should be so.

7. Use of climate models as truth. Because there are not sufficient high-quality, globally-distributed, and long term observations of climate fluctuations to study and better understand the climate system with, computerized climate models are now regarded as truth. The modelers’ belief that climate models represent truth is evident from the language they use: climate models are not “tested” with real data, but instead “validated”. The implication is clear: if the data do not agree with the models, it must be the data’s fault.

8. Claims that climate models have been tested. A hallmark of a good theory is that it should predict something which, upon further investigation, turns out to be correct. To my knowledge, climate models have not yet forecasted anything of significance. And even if they did, models are ultimately being relied upon to forecast global warming (aka ‘climate change’). As far as I can tell, there is no good way to test them in this regard. And please don’t tell me they can now replicate the seasons quite well. Even the public could predict the seasons before there were climate models. Predicting future warming (or cooling) is slightly more difficult, but not by much: a flip a coin will be correct 50% of the time.

9. The claim that the IPCC is unbiased. The IPCC was formed for the explicit purpose of building the case for global warming being our fault, not for investigating the possibility that it is just part of a natural cycle in the climate system. Their accomplices in government have bought off the scientific community for the purpose of achieving specific policy goals.
Spencer was the science team leader for the radiometer on NASA's Aqua satellite, and he is a principle scientist at UAH itself.
TheKwas
Padawan Learner
Posts: 401
Joined: 2007-05-15 10:49pm

Re: Hacked E-mails from Climate Scientists released

Post by TheKwas »

As a made-up example, if U.S. station XYZ hypothetically fully accurately corrected for the presence of a city 2.4 miles away during the 1980s which expanded to have its outskirts within 0.63 miles distance later, every year making extremely sophisticated corrections ... what about the thousands of other stations down to random Kazakhstan station WNM? (Some even think past 20th-century surface temperature data may be affected by little factors like how reportedly Soviet villages in Siberia got a Vodka benefit if they reported to the government a temperature dropping below -15 degrees Celsius). Remember that such is trying to exactly quantify a subtle trend of a fraction of a degree in an average over decades, when temperatures are going up and down by many degrees due to regionally varying factors all the time.

If merely a single major country's reports averaged at some time in 20th-century history being off by a degree or two in accurate adjustments, that would affect the global average surface temperature record by only a small fraction of a degree, yet small fractions of a degree are what these subtle trends are all about.
I'm a bit late on this, but this entire line of reasoning is based off the assumption that climatologists everywhere are fucking retarded. If you believe that this is a plausible explanation for the increase in reported temperatures, there's an easy way to test this: Go into the data, and find a single country that is experiencing rapid temperature growth and illustrate that the rest of the world is pretty much average. This is relatively easy thing to do, so get working or stop making up completely unbelievable fairy-tales.

The reason why there's no groundbreaking paper that attributes the increase in global temperatures to a bunch of hacks in Kazhakstan is because they already have data for numerous regions and all the major regions are experiencing an increase in temperatures in the long run.
Despite claiming to mix in UAH data, they modify the satellite data to make that graph, as current data at the UAH site (http://climate.uah.edu/dec2008.htm) can be compared in contrast:
They modify ALL satellite data, because the satellite data doesn't measure temperature in the first place. From the explanation on wikipedia:
"his figure compares the global average surface temperature record, as compiled by Jones and Moberg (2003; data set TaveGL2v with 2005 updates), to the microwave sounder (MSU) satellite data of lower atmospheric temperatures determined by Christy et al. (UAH 2003; data set tltglhmam version 5.2 with 2005 updates) and Schabel et al. (RSS 2002; data set tlt_land_and_ocean with 2005 updates). These two satellite records reflect two different ways of interpreting the same set of microwave sounder measurements and are not independent records. Each record is plotted as the monthly average and straight lines are fit through each data set from January 1982 to December 2004. The slope of these lines are 0.187°C/decade, 0.163°C/decade, and 0.239°C/decade for the surface, UAH, and RSS respectively.

It is important to know that the 5.2 version of Christy et al.'s satellite temperature record contains a significant correction over previous versions. In summer 2005, Mears and Wentz (2005) discovered that the UAH processing algorithms were incorrectly adjusting for diurnal variations, especially at low latitude. This correction raised the trend line 0.035°C/decade, and in so doing brought it into much better agreement with the ground based records and with independent satellite based analysis (e.g. Fu et al. 2004). The discovery of this error also explains why their satellite based temperature trends had disagreed most prominently in the tropics.
"


As for your chart, run a linear approximation through it. From visual inspection it looks identical to the graph Turtle posted (and thus generally in line with ground measurements). A cold year in 2009 is still warmer than the mean.
User avatar
D.Turtle
Jedi Council Member
Posts: 1909
Joined: 2002-07-26 08:08am
Location: Bochum, Germany

Re: Hacked E-mails from Climate Scientists released

Post by D.Turtle »

Starglider wrote:No, the question is, can this be treated as a representative sample of the antics going on at similar organisations? Until someone comes up with counterexamples (e.g. a similar AGW-supporting model that is clearly explained, well written and fully published), I would have to say yes. Even if not, the utterly sloppiness, contempt for the scientific method and dishonesty in the presentation of results that the CRU seems to have shown has damaged the whole field of climate science, and that is just another reason why the involved parties should be fired.
Since somehow this seems to be missed every single time:

Here is a nice summary of links to RAW UNMODIFIED DATA, SOURCE CODES of GCMs, and much more.

So go ahead, look at it and see if its better.

And just as a small note: GISSTEMP, the processed data used for the GISS GCM Models is completely independent from any data from CRU... So even IF there were a big problem with their data, it wouldn't matter one iota.

As for your question of why the mess: Thats what the fucking guy was doing: Putting together various old (messed up) databases in order to construct a proper one...

And note that that project had nothing to do with HadCRU which is completely independent from that effort, and is the more important database of the two.
Gilthan wrote:Despite claiming to mix in UAH data, they modify the satellite data to make that graph, as current data at the UAH site (http://climate.uah.edu/dec2008.htm) can be compared in contrast:
Erm, looks almost exactly the same as what I posted, except that yours only includes one average value per year, while the one I posted had multiple values. And looking at your chart and drawing a linear average line through it, you would see a rise in the average anomaly over time (Hint: You don't connect only the first and last points, but go for an average).
They have the largest archive of global surface temperature data in the world (although, as the news article of the last quote in my prior post mentioned, their head Prof. Jones not only refuses to release the surface station data but also "accidentally" deleted some of that raw data). The global surface station data would be affected. The UAH satellite data with its different, lesser trend shown? Not so much.
They didn't delete any of the raw source data, because they don't have access to that, because they get that data from various National Meteorological Services. Which also is the reason they can't give out the raw data...

But, lucky us, there are OTHER SOURCES for raw data.

As for Roy Spencer, here is a nice post about the shenanigans he is up to.

And looking at his web site, the fact that he claims that the roots of RealClimate.org can be found with George Soros immediately disqualifies him from serious consideration.
User avatar
Starglider
Miles Dyson
Posts: 8709
Joined: 2007-04-05 09:44pm
Location: Isle of Dogs
Contact:

Re: Hacked E-mails from Climate Scientists released

Post by Starglider »

D.Turtle wrote:Here is a nice summary of links to RAW UNMODIFIED DATA, SOURCE CODES of GCMs, and much more.

So go ahead, look at it and see if its better.
I just downloaded the source for the GISS model (which seems to be the main model NASA are supporting) and had a quick scan through. Obviously in 15 minutes of looking at random modules I can only get a rough impression, but it does seem much better architectured and implemented than the files posted online from the CRU codebase. Futhermore it is being developed as open source and the project mailing list evidences what seems to be an appropriate review process.

So from two data points rather than one (and my completely non-expert analysis), I would say that CRU seem like parasites clinging onto the body of actual climate science, more interested in politics than proving anything. As such they should be denounced and defunded ASAP. In practice an independent audit of all publically funded climate research would be a good idea in order to rebuild public confidence and get rid of any other scammers and pretenders that may have infested the system. The team at GISS may well be in a position to advise public policy, but clearly not all seemingly-credible projects are so capable.
Gilthan
Youngling
Posts: 88
Joined: 2009-11-06 07:07am

Re: Hacked E-mails from Climate Scientists released

Post by Gilthan »

TheKwas wrote:As for your chart, run a linear approximation through it. From visual inspection it looks identical to the graph Turtle posted (and thus generally in line with ground measurements).
They're not the same, although actually the graph Turtle posted is significantly less different than the CRU data (where CRU is the group of this scandal, maintaining the global climate record for the World Meteorological Organization).

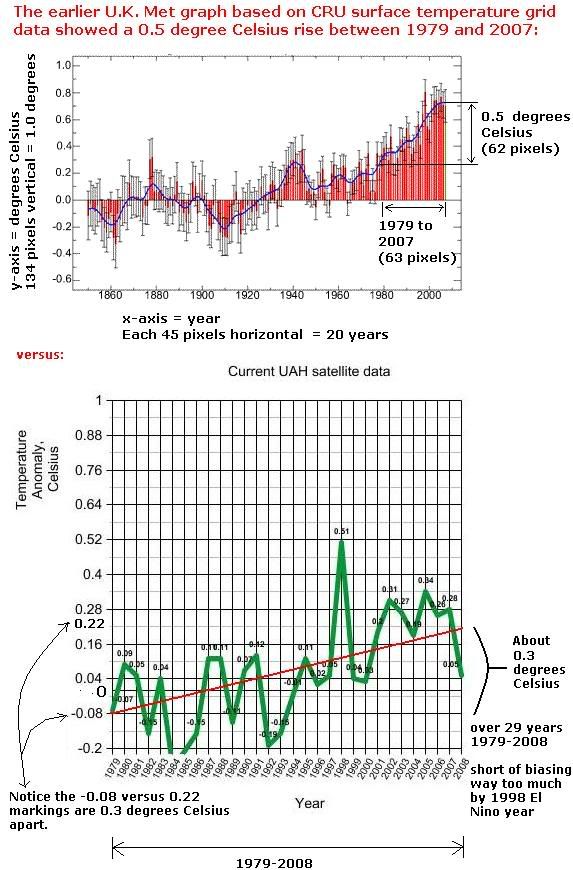
Anyway, the U.K. Met office gets this from CRU data:

Image

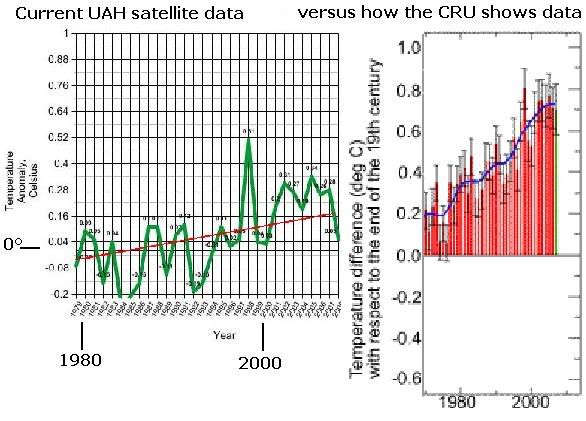
If the part of that chart from the late 1970s through early 2000s is moved beside the graph I made from UAH data, with the -0.2 to +1 degree Celsius portion of the scales matched up, the difference becomes particularly obvious:

Image

Remember, once again, that my graph is verifiable by data at the end of http://climate.uah.edu/dec2008.htm (although one would want to scroll back up earlier to the original bigger version of my graph to read the numbers better for comparison).
TheKwas wrote:I'm a bit late on this, but this entire line of reasoning is based off the assumption that climatologists everywhere are fucking retarded. If you believe that this is a plausible explanation for the increase in reported temperatures, there's an easy way to test this: Go into the data, and find a single country that is experiencing rapid temperature growth and illustrate that the rest of the world is pretty much average.
No, I'm not talking about your simplistic assumption that global warming must be all or nothing, so therefore the rest of the world would be expected to show no temperature rise if some surface temperature data was not being perfectly corrected for urban heat island or other sources of error. Quantifying the magnitude of global warming is a matter of tenths of a degree Celsius per several decades and at most hundredths of a degree Celsius per year. Distinguishing a temporary inaccuracy somewhere in the historical record like some villages in Siberia reporting temperatures off by 1.6 degrees in the 1958-1964 time period (a made-up imaginary example) would be extremely hard to distinguish from actual weather variation.
TheKwas wrote:The slope of these lines are 0.187°C/decade, 0.163°C/decade, and 0.239°C/decade for the surface, UAH, and RSS respectively.

It is important to know that the 5.2 version of Christy et al.'s satellite temperature record contains a significant correction over previous versions. In summer 2005, Mears and Wentz (2005) discovered that the UAH processing algorithms were incorrectly adjusting for diurnal variations, especially at low latitude.
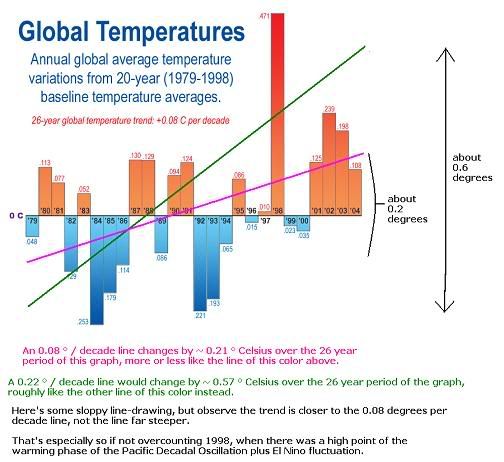
That's what those two guys claimed, and, in contrast, UAH itself shows different data on its website. Note how they claim UAH data shows 0.16 degrees Celsius per decade, a rate like 0.5 degrees Celsius increase over 30 years? Well, the UAH estimate explicitly shown at http://climate.uah.edu/maps/26yeargraf.jpg is 0.08 degrees Celsius a decade, a rate proportionally like around 0.24 degrees Celsius per 30 years.

This argument has been going on so long that it could be easy to lose track of the original context, but I was pointing out in my very first post the huge distinction between: the actual historical temperature rise on the order of 0.2 degrees Celsius over the past 30 years, versus widely publicized predictions by some groups ranging up to 6 degrees Celsius (dozens of times more) over the next 90 years.
User avatar
D.Turtle
Jedi Council Member
Posts: 1909
Joined: 2002-07-26 08:08am
Location: Bochum, Germany

Re: Hacked E-mails from Climate Scientists released

Post by D.Turtle »

Gilthan wrote:Anyway, the U.K. Met office gets this from CRU data:

Image
You do realise that that chart is zeroed (aka the Anomaly is 0) for 1900, while the other one is zeroed for the 1978-1998 average?

Which makes your next chart slightly wrong. Instead (using my bad photoshop skills) moving the chart on the right down so that the starting date/temperatures are the same you get the following:
Image
Looking at that, seems like a relatively good fit. Also notice, that the starting point of the one on the right is 1970, while the one on the left is 1980, which makes the large rise in 1970-1980 seem out of place. I could overlay them to make it even more obvious...
That's what those two guys claimed, and, in contrast, UAH itself shows different data on its website. Note how they claim UAH data shows 0.16 degrees Celsius per decade, a rate like 0.5 degrees Celsius increase over 30 years? Well, the UAH estimate explicitly shown at http://climate.uah.edu/maps/26yeargraf.jpg is 0.08 degrees Celsius a decade, a rate proportionally like around 0.24 degrees Celsius per 30 years.
I have no idea how that number was arrived at (a simple average - aka adding all the anomalies together and dividing by 2.6 - results in about 0.22 degrees per decade), especially since they say on their own site that:
UAH wrote:From Nov. 16, 1978, through June 30, 2007, the global lower troposphere has warmed about 0.4 Celsius (about 0.72° Fahrenheit), or global warming at the rate of approximately 1.4 C (about 2.52° Fahrenheit) per century.
Which would mean about 0.133 degrees per decade.

By the way, this would be the long time anomaly from the GISSTEMP data (aka not affiliated with CRU):
Image
No warming at all there ....

Off Topic: Whats a good free photoshop program? Using Paint and OpenOffice Draw really sucks.
Gilthan
Youngling
Posts: 88
Joined: 2009-11-06 07:07am

Re: Hacked E-mails from Climate Scientists released

Post by Gilthan »

D.Turtle wrote:Instead (using my bad photoshop skills) moving the chart on the right down so that the starting date/temperatures are the same you get the following:

[img<snip>]http://i50.tinypic.com/2psgah4.jpg[/img]

Looking at that, seems like a relatively good fit.
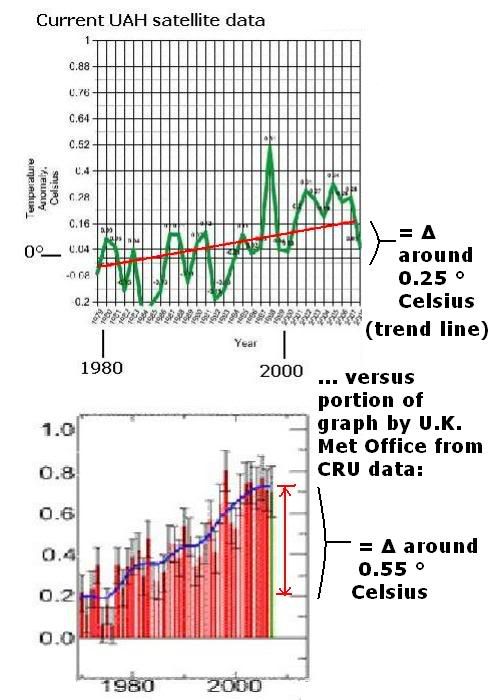
Actually no. The two different graphs aren't a good fit of similarity at all, as one has a trend line closer to 0.25 degrees from 1979 through 2008, while the other has a trend closer to 0.55 degrees from the late 1970s through the early 2000s. I'll show why here by moving the segments of your graph apart and adding labeling:

Image
D.Turtle wrote:Also notice, that the starting point of the one on the right is 1970, while the one on the left is 1980, which makes the large rise in 1970-1980 seem out of place. I could overlay them to make it even more obvious...
No.

While my graph wasn't fancy since I threw it together fast in what this computer has (only paintbrush), you're frankly terrible at reading it. There's a big mark for 1980 near the left of the above graph, as it starts in 1979, not 1970.

I'll repeat the bigger original version of it once more, to be more clear:

Image

Again, that's from http://climate.uah.edu/dec2008.htm where the range is 1979 to 2008 for the data at the bottom.
D.Turtle wrote:
That's what those two guys claimed, and, in contrast, UAH itself shows different data on its website. Note how they claim UAH data shows 0.16 degrees Celsius per decade, a rate like 0.5 degrees Celsius increase over 30 years? Well, the UAH estimate explicitly shown at http://climate.uah.edu/maps/26yeargraf.jpg is 0.08 degrees Celsius a decade, a rate proportionally like around 0.24 degrees Celsius per 30 years.
I have no idea how that number was arrived at (a simple average - aka adding all the anomalies together and dividing by 2.6 - results in about 0.22 degrees per decade)
They themselves wrote 0.08 degrees Celsius per decade on their http://climate.uah.edu/maps/26yeargraf.jpg graph, maybe obtained as the average trend through linear regression like the least-squares method (something I'd illustrate myself here if I had Excel running but don't want to spend the time to do it manually). However, here's an illustration how such is way closer than your 0.22 degrees per decade:

Image

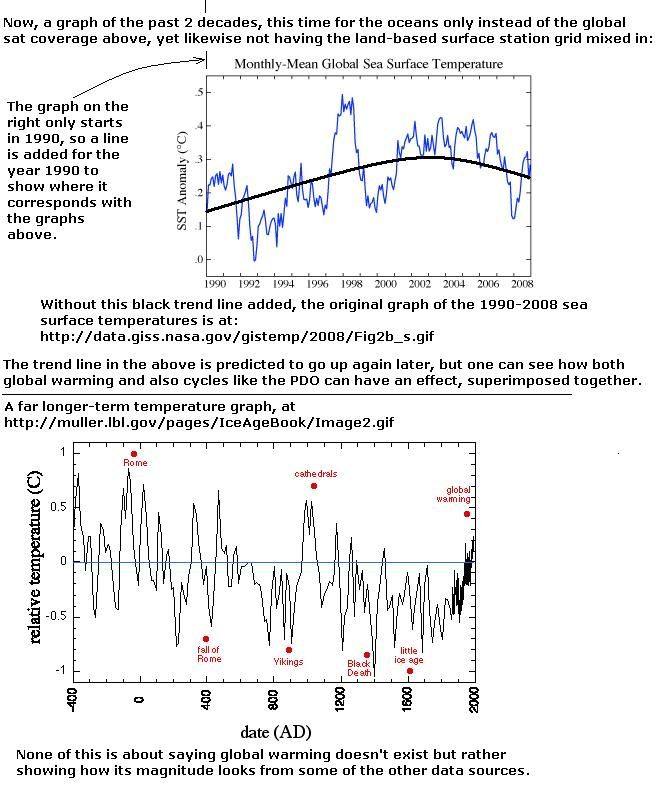
Although it has been posted before, it is only appropriate to post in this context the graph that best illustrates the overall trend seen by UAH's satellite data, the curved black line in this:

Image

As for GISSTEMP versus CRU, how little or how much they share surface temperature station sources as opposed to having utterly independent networks worldwide would have to be investigated.
Gilthan
Youngling
Posts: 88
Joined: 2009-11-06 07:07am

Re: Hacked E-mails from Climate Scientists released

Post by Gilthan »

Although global warming superimposes some warming on other trends, part of the reason for why global temperatures go up and down semi-cyclically are internal forcings. Usually people are used to thinking in terms of external forcings like solar activity, but there also are oscillations like the oceanic PDO:

http://wwwpaztcn.wr.usgs.gov/rsch_highl ... series.jpg

Image

In the 1940s, both of the above were high, and there were high temperatures worldwide. In the later part of the 1990s, both of them were high again, and there were particularly high temperatures in the late 1990s.

Such is far from the only factor, and indeed there is some effect of global warming outside of it ... just one a major factor.
Gilthan
Youngling
Posts: 88
Joined: 2009-11-06 07:07am

Re: Hacked E-mails from Climate Scientists released

Post by Gilthan »

Minor correction:
D.Turtle wrote:Also notice, that the starting point of the one on the right is 1970, while the one on the left is 1980
Forget my first response to this, actually, as I wrote too fast. The part I said about the UAH graph starting in 1979 is correct (not your round number assumption), but my first draft incorrectly made it sound like I was implying the cropped portion of the Met graph didn't start in 1970.
User avatar
D.Turtle
Jedi Council Member
Posts: 1909
Joined: 2002-07-26 08:08am
Location: Bochum, Germany

Re: Hacked E-mails from Climate Scientists released

Post by D.Turtle »

Ok, shithead, so I had to do the work of overlaying your two graphs, and this is the result:
Image
Both starting in 1979.

As for satellite data, I find it interesting (not really) that you do not use the other source of satellite data, who have this graph:
Image

And I repeat again: UAH themselves say and I quote (again):
UAH wrote:
Global Temperature Report: December 2008

Global trend since Nov. 16, 1978: +0.13 C per decade
So once again, no idea where that 0.08 comes from, and even if it WAS 0.08, that would not matter because the time scale is too short. Which is why longer time scales become important, which is where temperature data from the last hundred years comes in.

As for the so-called warming pause, I'll quote from The Copenhagen Diagnosis: Climate Science Report:
Is the Warming Natural or Human-Induced?
Our understanding of the causes of the recent century-scale
trend has improved further since the IPCC AR4. By far the
greatest part of the observed century-scale warming is due to
human factors. For example, Lean and Rind (2008) analyzed the
role of natural factors (e. g., solar variability, volcanoes) versus
human influences on temperatures since 1889. They found that
the sun contributed only about 10% of surface warming in the
last century and a negligible amount in the last quarter century,
less than in earlier assessments. No credible scientific literature
has been published since the AR4 assessment that supports
alternative hypotheses to explain the warming trend.
Is Warming Occurring Higher up in the
Atmosphere?
The IPCC AR4 noted a remaining uncertainty in temperature
trends in the atmosphere above the lowest layers near the Earth’s
surface. Most data sets available at that time showed weaker
than expected warming in the atmospheric region referred to as
the tropical upper troposphere, ten to fifteen kilometers above
the surface. However, the observations suffered from significant
stability issues especially in this altitude region. Researchers
have since performed additional analyses of the same data
using more rigorous techniques, and developed a new method
of assessing temperature trends from wind observations (Allen
and Sherwood 2008). The new observational estimates show
greater warming than the earlier ones, and the new, larger set of
estimates taken as a whole now bracket the trends predicted by
the models (Thorne 2008). This resolves a significant ambiguity
expressed in AR4 (Santer et al. 2008).
And
Has global warming recently slowed down or paused?
No. There is no indication in the data of a slowdown or pause in the human-caused climatic warming trend. The observed
global temperature changes are entirely consistent with the climatic warming trend of ~0.2 °C per decade predicted by
IPCC, plus superimposed short-term variability (see Figure 4). The latter has always been – and will always be – present in
the climate system. Most of these short-term variations are due to internal oscillations like El Niño – Southern Oscillation,
solar variability (predominantly the 11-year Schwabe cycle) and volcanic eruptions (which, like Pinatubo in 1991, can cause
a cooling lasting a few years).
If one looks at periods of ten years or shorter, such short-term variations can more than outweigh the anthropogenic global
warming trend. For example, El Niño events typically come with global-mean temperature changes of up to 0.2 °C over a few
years, and the solar cycle with warming or cooling of 0.1 °C over five years (Lean and Rind 2008). However, neither El Niño,
nor solar activity or volcanic eruptions make a significant contribution to longer-term climate trends. For good reason the
IPCC has chosen 25 years as the shortest trend line they show in the global temperature records, and over this time period
the observed trend agrees very well with the expected anthropogenic warming.
Nevertheless global cooling has not occurred even over the past ten years, contrary to claims promoted by lobby groups and
picked up in some media. In the NASA global temperature data, the past ten 10-year trends (i.e. 1990-1999, 1991-2000
and so on) have all been between 0.17 and 0.34 °C warming per decade, close to or above the expected anthropogenic trend,
with the most recent one (1999-2008) equal to 0.19 °C per decade. The Hadley Center data most recently show smaller
warming trends (0.11 °C per decade for 1999-2008) primarily due to the fact that this data set is not fully global but leaves
out the Arctic, which has warmed particularly strongly in recent years.
It is perhaps noteworthy that despite the extremely low brightness of the sun over the past three years (see next page);
temperature records have been broken during this time (see NOAA, State of the Climate, 2009). For example, March 2008
saw the warmest global land temperature of any March ever measured in the instrumental record. June and August 2009
saw the warmest land and ocean temperatures in the Southern Hemisphere ever recorded for those months. The global ocean
surface temperatures in 2009 broke all previous records for three consecutive months: June, July and August. The years 2007,
2008 and 2009 had the lowest summer Arctic sea ice cover ever recorded, and in 2008 for the first time in living memory
the Northwest Passage and the Northeast Passage were simultaneously ice-free. This feat was repeated in 2009. Every single
year of this century (2001-2008) has been among the top ten warmest years since instrumental records began.

Image

Figure 4. Global temperature according to NASA GISS data since 1980. The red line shows annual data, the red square
shows the preliminary value for 2009, based on January-August. The green line shows the 25-year linear trend (0.19 °C
per decade). The blue lines show the two most recent ten-year trends (0.18 °C per decade for 1998-2007, 0.19 per decade
for 1999-2008) and illustrates that these recent decadal trends are entirely consistent with the long-term trend and IPCC
predictions. Misunderstanding about warming trends can arise if only selected portions of the data are shown, e.g. 1998 to
2008, combined with the tendency to focus on extremes or end points (e.g. 2008 being cooler than 1998) rather than an
objective trend calculation. Even the highly “cherry-picked” 11-year period starting with the warm 1998 and ending with the
cold 2008 still shows a warming trend of 0.11 °C per decade.
Gilthan wrote:
As for GISSTEMP versus CRU, how little or how much they share surface temperature station sources as opposed to having utterly independent networks worldwide would have to be investigated.
AFAIK, they both get the vast majority of their raw data from the Global Historical Climatology Network. As for CRU, I'd just like to repeat the following:
RealClimate wrote:# HARRY_read_me.txt. This is a 4 year-long work log of Ian (Harry) Harris who was working to upgrade the documentation, metadata and databases associated with the legacy CRU TS 2.1 product, which is not the same as the HadCRUT data (see Mitchell and Jones, 2003 for details). The CSU TS 3.0 is available now (via ClimateExplorer for instance), and so presumably the database problems got fixed. Anyone who has ever worked on constructing a database from dozens of individual, sometimes contradictory and inconsistently formatted datasets will share his evident frustration with how tedious that can be.
Gilthan
Youngling
Posts: 88
Joined: 2009-11-06 07:07am

Re: Hacked E-mails from Climate Scientists released

Post by Gilthan »

D.Turtle wrote:Ok, shithead, so I had to do the work of overlaying your two graphs, and this is the result:
No, you need to actually look at the scales on the left and measure. Here, I'll show the difference with a higher quality depiction:

Image

Actually, I'll sum up a lot of points in graphical form, using your graph as part:

Image

Image
User avatar
Darth Wong
Sith Lord
Sith Lord
Posts: 70028
Joined: 2002-07-03 12:25am
Location: Toronto, Canada
Contact:

Re: Hacked E-mails from Climate Scientists released

Post by Darth Wong »

When I look at political reaction to those E-mails, and particularly the language in them, I can't help but think that almost nobody has ever done any kind of lab work. I can't say how jocular these particular people are, having never met them. But I can say that informally, when I was in school, people would joke about massaging data all the time. That didn't mean we were actually doing it. It was sort of like lab project black humour. Even if we were just trying to organize it, we would call it "massaging the data". It had to be one of our most commonly used phrases.

Another example: at the end of any given lab project, my partners and I would jauntily announce that we were headed off to "bullshit our way into a result". That doesn't mean we were actually going to conduct fraudulent activity; it's just the way we talked. Hell, at every job I ever had, there was always some sort of in-house black humour relating to doing our jobs in a fraudulent, incompetent, or unreasonable way. It didn't mean we were actually literally doing so.
Image
"It's not evil for God to do it. Or for someone to do it at God's command."- Jonathan Boyd on baby-killing

"you guys are fascinated with the use of those "rules of logic" to the extent that you don't really want to discussus anything."- GC

"I do not believe Russian Roulette is a stupid act" - Embracer of Darkness

"Viagra commercials appear to save lives" - tharkûn on US health care.

http://www.stardestroyer.net/Mike/RantMode/Blurbs.html
User avatar
Wyrm
Jedi Council Member
Posts: 2206
Joined: 2005-09-02 01:10pm
Location: In the sand, pooping hallucinogenic goodness.

Re: Hacked E-mails from Climate Scientists released

Post by Wyrm »

I believe I used the word "massage" in the program I used to process the raw proper motion data into something I could use more directly for my MCMC simulation. Anyone who reads my program (and understands R) can verify for themselves that I didn't mean "massage" to mean "alter data to a predetermined result."
Darth Wong on Strollers vs. Assholes: "There were days when I wished that my stroller had weapons on it."
wilfulton on Bible genetics: "If two screaming lunatics copulate in front of another screaming lunatic, the result will be yet another screaming lunatic. 8)"
SirNitram: "The nation of France is a theory, not a fact. It should therefore be approached with an open mind, and critically debated and considered."

Cornivore! | BAN-WATCH CANE: XVII | WWJDFAKB? - What Would Jesus Do... For a Klondike Bar? | Evil Bayesian Conspiracy
Post Reply