Hacked E-mails from Climate Scientists released

N&P: Discuss governments, nations, politics and recent related news here.

Moderators: Alyrium Denryle, Edi, K. A. Pital

Post Reply
User avatar
Starglider
Miles Dyson
Posts: 8709
Joined: 2007-04-05 09:44pm
Location: Isle of Dogs
Contact:

Re: Hacked E-mails from Climate Scientists released

Post by Starglider »

Darth Wong wrote:When I look at political reaction to those E-mails, and particularly the language in them, I can't help but think that almost nobody has ever done any kind of lab work.
To be fair, neither have these researchers - they're not doing lab work, they're coding up computer models. Sure, a few researchers go off drilling ice cores or setting up monitoring stations in remote places, but for this bunch it seems to be just writing papers, writing sloppy code (or rather, making the grad students write sloppy code), brunching with environmentalists, and attending conferences in sunny locales.
But I can say that informally, when I was in school, people would joke about massaging data all the time. That didn't mean we were actually doing it. It was sort of like lab project black humour.
I know what you mean, but you weren't under political pressure to produce results. In a normal PhD, you can completely fail to validate your initial hypothesis, and as long as you write up your experimental work nicely and do a thorough literature survey, your thesis will still be accepted. Climate science is unfortunately one of the most politicised disciplines around, with extreme pressure (from both sides) to both corrupt existing researchers and attract hangers-on who learn the jargon and then pose as legitimate scientists. Combined with the 'ends justifies the means' mentality that the notion of 'saving the world' (for the AGW supporters) or 'saving western civilisation' (for the AGW opponents) produces, and it's unsurprising that real cheating occurs.

Furthermore, accepting that the discipline is horribly politicised, such language should not be used even if the intent is innocent. Open review is absolutely essential for models that attempt to inform policy making - this code was clearly never intended to withstand general scrutiny, yet it is an integral part of reports that advocate sweeping economic changes.
User avatar
Guardsman Bass
Cowardly Codfish
Posts: 9281
Joined: 2002-07-07 12:01am
Location: Beneath the Deepest Sea

Re: Hacked E-mails from Climate Scientists released

Post by Guardsman Bass »

Furthermore, accepting that the discipline is horribly politicised, such language should not be used even if the intent is innocent.
These were private e-mails, never intended to be open for public viewing. Are you suggesting that scientists in that field should write their e-mails in politically neutral, non-attackable language on the off-chance that somebody will hack into their e-mail accounts and publish what's there?
“It is possible to commit no mistakes and still lose. That is not a weakness. That is life.”
-Jean-Luc Picard


"Men are afraid that women will laugh at them. Women are afraid that men will kill them."
-Margaret Atwood
User avatar
Questor
Jedi Council Member
Posts: 1601
Joined: 2002-07-17 06:27pm
Location: Landover

Re: Hacked E-mails from Climate Scientists released

Post by Questor »

Guardsman Bass wrote:
Furthermore, accepting that the discipline is horribly politicised, such language should not be used even if the intent is innocent.
These were private e-mails, never intended to be open for public viewing. Are you suggesting that scientists in that field should write their e-mails in politically neutral, non-attackable language on the off-chance that somebody will hack into their e-mail accounts and publish what's there?
Well I do it because, since I work at a publicly funded institution, I know that my emails are not private and can theoretically, be put in the full view of the public, barring any to certain individuals.
User avatar
Starglider
Miles Dyson
Posts: 8709
Joined: 2007-04-05 09:44pm
Location: Isle of Dogs
Contact:

Re: Hacked E-mails from Climate Scientists released

Post by Starglider »

Guardsman Bass wrote:Are you suggesting that scientists in that field should write their e-mails in politically neutral, non-attackable language on the off-chance that somebody will hack into their e-mail accounts and publish what's there?
I was referring to the design documentation and source code comments for their modelling and data-preprocessing code. That code should never have been withheld in the first place; if they felt unable to release it, they should have billed their results as 'highly preliminary' and requested funding to write a decent version (though as I've said, they had quite sufficient funding, and other groups have done a much more professional job of it). Instead the CRU seems completely satisfied with their secret, crappy code and feel that this is a sufficient basis to make sweeping policy recommendations.

I am reluctant to comment on the emails - the anti-AGW crowd (e.g. the people in the thread on HPCA) are claiming that they are thoroughly damning when fitted into an overall context of reprehensible behavior from the key people at CRU. I don't know the context, since I haven't been paying much attention to this debate, so I don't feel qualified to give even a passing judgement. However I will say that whenever you write an email, the possibility of public release should always be at the back of your mind - never mind hacking, you can never be sure who the recipient might forward it to (and who they might forward it to and so on).
Gilthan
Youngling
Posts: 88
Joined: 2009-11-06 07:07am

Re: Hacked E-mails from Climate Scientists released

Post by Gilthan »

Some interesting and indirectly related articles, quoting in part:

http://www.theregister.co.uk/2009/01/28 ... ate_theon/
The retired scientist formerly in charge of key NASA climate programs has come out as a sceptic.

Theon takes aim at the models, and implicitly criticises Hansen for revising to the data set:

“My own belief concerning anthropogenic climate change is that the models do not realistically simulate the climate system because there are many very important sub-grid scale processes that the models either replicate poorly or completely omit. Furthermore, some scientists have manipulated the observed data to justify their model results. In doing so, they neither explain what they have modified in the observations, nor explain how they did it.

"They have resisted making their work transparent so that it can be replicated independently by other scientists. This is clearly contrary to how science should be done. Thus there is no rational justification for using climate model forecasts to determine public policy.”

Hansen is in charge of the GISS data set, derived from readings published by NOAA. The GISS adjustment have received criticism (a potted summary here) for revising the historic record in an upward direction - and making undocumented and unexplained revisions.

Hansen has called for energy industry executives to be jailed for dissenting from the man-made warming hypothesis.

Update: The EPW Minority office has published Theon's correspondence in full, including his resume. In a 37-year career at NASA, his titles included Chief of the Atmospheric Dynamics, Radiation, & Hydrology Branch followed by a stint as Chief of the Climate Processes Research Program at NASA HQ.
http://www.theregister.co.uk/2008/11/19 ... print.html
Last week the October data started to be released. First, UAH (the University of Alabama at Huntsville) and RSS (Remote Sensing Systems) - the two groups that measure satellite data for lower troposphere - weighed in. The temperature anomaly for October was much the same as September, they reported approximately 0.2°C over the 1979-2000 average for each of those months.

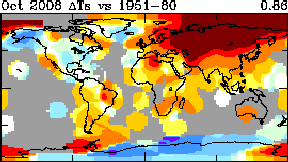
But GISS, unlike UAH or RSS showed a startling jump, indicating the warmest October ever recorded.
Image
Hot all over: NASA's first attempt at October

Ironically for a space organization, NASA/GISS does not use satellites, but prefers to use readings from the surface stations of the National Oceanic & Atmospheric Administration (NOAA).

The map featured a huge red-brown area over Siberia that drew immediate attention. Readers from the blog run by metereologist Anthony Watts, WattsUpWithThat, soon determined what was wrong. The data for a large number of northern stations had their September numbers carried over to October.

After Steve McIntyre of the Climate Audit blog emailed GISS informing them of the error. GISS issued a new set of data the next day, with Gavin Schmidt crediting Watts' blog with spotting the error (while studiously avoiding mentioning McIntyre).

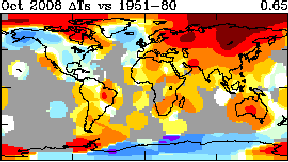
The revised map still showed Siberia to be fairly warm. England and Ireland were no longer in the red zone, while North West Canada was somewhat cooler. But the Hudson Bay area (previously not included) was filled in - in red.
Image
NASA tries again

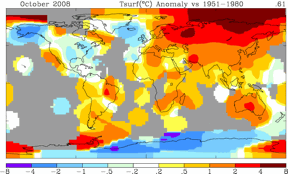
The next day the data was adjusted yet again. The Hudson Bay data is removed (but NW Canada was "re-heated" to its original level). The Siberian hot spot was reduced, and the global anomaly stands - for now (http://data.giss.nasa.gov/gistemp/graphs/) - at a whopping 0.25°C lower than their original announcement.
Image
NASA's Third Attempt

NASA acknowledges the changes, but other than that provides no details nor any explanation whatever. The older versions of the maps are removed from their site. So why did neither GISS nor NOAA see fit to take a second look?

In all, September data from 90 stations was used in October. GISS director Hansen claimes that data analysis and quality control is rigorous:

Our analysis programs that ingest GHCN [Global Historical Climate Network] data include data quality checks that were developed for our earlier analysis of MCDW [Monthly Climatic Data for the World] data. Retention of our own quality control checks is useful to guard against inadvertent errors in data transfer and processing, verification of any added near-real-time data, and testing of that portion of the GHCN data.

Yet despite receiving a federal budget of over $1bn for climate work, Schmidt admitted last week that only one quarter of a full-time employee checks the data.

"Current staffing from the GISTEMP analysis is about 0.25 FTE [Full-Time Employee] on an annualised basis (I’d estimate - it is not a specifically funded GISS activity)," wrote Schmidt.

On this occasion, neither GISS nor NOAA saw fit to take a second look, a curious response considering that results were such an outlier.

A history of warming

This latest episode is not the first time that GISS, under the authority of Hansen, has operated in an opaque manner. In 1999, GISS data showed the 1930s US temperature to be considerably warmer than that of the 1990s. But the current version shows the 1930s adjusted to a much lower level.

In 2007, while examining GISS data, McIntyre caught what turned out to be, of all things, a "Y2K" code error that forced a GISS to change the hottest year on US record to 1934. (Subsequent "improvements" have rectified this situation and 1934 reigns no more, but is tied with 1998.)

Dr Hansen had refused to release his adjustment code, but the Y2K incident caused him to relent. He provided a dump of undocumented, non-working FORTRAN code which Climate Audit coders, after much time and effort, eventually managed to get running.

It became apparent that Hansen's code that adjusted for missing data (FILNET) had arbitrarily adjusted the 20th Century temperature trend upwards several times by 0.1°C at regular intervals - with no explanation.

(GISS takes NOAA adjusted data and applies an "unadjustment" procedure; why they do not simply start with NOAA raw data remains a mystery. They then apply their own adjustments. GISS UHI adjustment is particularly controversial, since many cities are adjusted warmer, not cooler, as one would expect from urban heat island effect.)

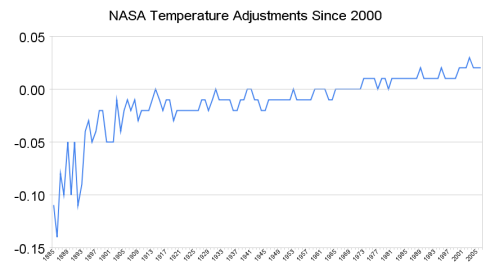
And Steven Goddard reported here how the historical data has been altered since 2000.
Image

Methods in the spotlight

Yes, GISS-adjusted historical data matches fairly well with that of the NOAA. But NOAA 20th century raw data trend is adjusted upwards by about 0.3°C. Missing data fill-in (FILNET) and Station history adjustment (SHAP) are both upward. But common sense tells us that the former should be near-neutral (interpolation) and the latter downward (poor station siting and urban creep having introduced often severe warming biases over the years).

In addition, NOAA's adjustment for Urban Heat Island (UHI) over the entire 20th century is an insignificant -0.06°C. Yet papers by McKitrick and Michaels [abstract - background] and by LaDochy et al [abstract] in late 2007 indicate that NASA and NOAA adjustment methods may exaggerate warming trends by a factor of two. (LaDochy estimates UHI trends are x2 during the day and x5 at night. If true, current UHI adjustment is too small.)

GISS makes unannounced, unexplained changes, and this practice is confusing and gets in the way of scholarship. GISS calibrates its data to 0.01°C. This implies a very high degree of accuracy and low margin of error. But their aggregate adjustments add up to tens of times greater than this scale. Therefore to provide data in hundredths of a degree is a clear case of misplaced precision.

Hansen's role as the director in charge of the evidence of climate change has also caused controversy. It was Hansen who gave the issue national prominence during the 1988 Senate hearings. Recently he has urged trials for "climate criminals" - energy executives who disagree with his hypothesis and policy prescription (for Hansen has both). Hansen traveled to England to testify for the defence of environmental activists who vandalized a coal power station.

Whatever their point of view, scientists' data, methods, and procedures should be properly archived and open to all. And as Dr. Hansen is, after all, a public servant in charge of a vitally important set of data, this imperative would seem to apply doubly.
A full reading of the above might help one guess the level of perfection and the level of impartiality without bias for the group's director.
[R_H]
Sith Devotee
Posts: 2894
Joined: 2007-08-24 08:51am
Location: Europe

Re: Hacked E-mails from Climate Scientists released

Post by [R_H] »

Climate change data dumped
SCIENTISTS at the University of East Anglia (UEA) have admitted throwing away much of the raw temperature data on which their predictions of global warming are based.

It means that other academics are not able to check basic calculations said to show a long-term rise in temperature over the past 150 years.

The UEA’s Climatic Research Unit (CRU) was forced to reveal the loss following requests for the data under Freedom of Information legislation.

The data were gathered from weather stations around the world and then adjusted to take account of variables in the way they were collected. The revised figures were kept, but the originals — stored on paper and magnetic tape — were dumped to save space when the CRU moved to a new building. The admission follows the leaking of a thousand private emails sent and received by Professor Phil Jones, the CRU’s director. In them he discusses thwarting climate sceptics seeking access to such data.

In a statement on its website, the CRU said: “We do not hold the original raw data but only the value-added (quality controlled and homogenised) data.”

The CRU is the world’s leading centre for reconstructing past climate and temperatures. Climate change sceptics have long been keen to examine exactly how its data were compiled. That is now impossible.

Roger Pielke, professor of environmental studies at Colorado University, discovered data had been lost when he asked for original records. “The CRU is basically saying, ‘Trust us’. So much for settling questions and resolving debates with science,” he said.

Jones was not in charge of the CRU when the data were thrown away in the 1980s, a time when climate change was seen as a less pressing issue. The lost material was used to build the databases that have been his life’s work, showing how the world has warmed by 0.8C over the past 157 years.

He and his colleagues say this temperature rise is “unequivocally” linked to greenhouse gas emissions generated by humans. Their findings are one of the main pieces of evidence used by the Intergovernmental Panel on Climate Change, which says global warming is a threat to humanity.
User avatar
Guardsman Bass
Cowardly Codfish
Posts: 9281
Joined: 2002-07-07 12:01am
Location: Beneath the Deepest Sea

Re: Hacked E-mails from Climate Scientists released

Post by Guardsman Bass »

What a nightmare. Since the skeptics are now pretty much calling the entire set of adjusted measurements fraudulent unless proven otherwise, the lack of the raw data means that it will be incredibly difficult to answer those claims (and that's assuming they can recover the data from a host of sources - more likely, they'll just have to collect and reconstruct an entire new raw dataset).
“It is possible to commit no mistakes and still lose. That is not a weakness. That is life.”
-Jean-Luc Picard


"Men are afraid that women will laugh at them. Women are afraid that men will kill them."
-Margaret Atwood
User avatar
D.Turtle
Jedi Council Member
Posts: 1909
Joined: 2002-07-26 08:08am
Location: Bochum, Germany

Re: Hacked E-mails from Climate Scientists released

Post by D.Turtle »

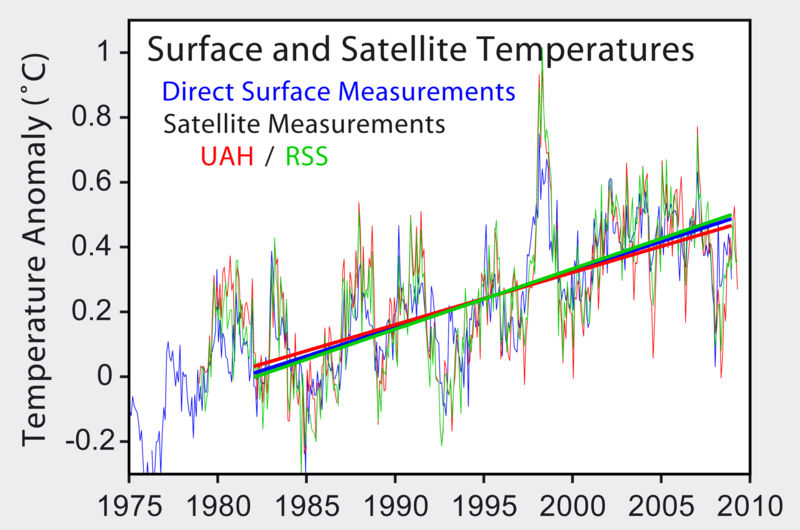
Gilthan wrote:No, you need to actually look at the scales on the left and measure. Here, I'll show the difference with a higher quality depiction:
Ok, I'm sick and tired of your graphs using different approximation algorithms, different temperature scales, and different time scales (which somehow all make the differences between the two sources seem a lot larger than they are).

The picture you replied to, was simplay an overlay of the pictures you had provided in which I stretched etc them in such a way that the years fit and the temperature scale was the same.

Doing the same with your new pictures results in these two graphs (the years and temperature scales fit as exactly as I can make them, exactly where to choose the starting point is a rough guess.

Image
Image

So, if you want to do something useful, produce pictures that use the same year scale, use the same temperature scale, and then use the same algorithm to show an average. Using a linear approximation on one graph and a highly NON-linear one on the other graphs is HUGELY deceptive.
Guardsman Bass wrote:What a nightmare. Since the skeptics are now pretty much calling the entire set of adjusted measurements fraudulent unless proven otherwise, the lack of the raw data means that it will be incredibly difficult to answer those claims (and that's assuming they can recover the data from a host of sources - more likely, they'll just have to collect and reconstruct an entire new raw dataset).
Here is a link that provides a lot of links to various sources of temperature data - including raw data:
Climate data (raw) wrote: Climate data (raw)
User avatar
Guardsman Bass
Cowardly Codfish
Posts: 9281
Joined: 2002-07-07 12:01am
Location: Beneath the Deepest Sea

Re: Hacked E-mails from Climate Scientists released

Post by Guardsman Bass »

That said, there is at least one effort to make the various datasets used in climate change research available (along with the raw data). Realclimate has posted a list of sources, including raw data, "processed" data, paleo-data, GCM model codes (you might want to look at those, Starglider), and so forth.

It won't satisfy the skeptics who are claiming that the CRU debacle has rendered all climate change research and data fraudulent until proven otherwise at every level, but it's a start.
“It is possible to commit no mistakes and still lose. That is not a weakness. That is life.”
-Jean-Luc Picard


"Men are afraid that women will laugh at them. Women are afraid that men will kill them."
-Margaret Atwood
User avatar
D.Turtle
Jedi Council Member
Posts: 1909
Joined: 2002-07-26 08:08am
Location: Bochum, Germany

Re: Hacked E-mails from Climate Scientists released

Post by D.Turtle »

Oh and here is the response on RealClimate on that Brouhaha about last year's October results.

In addition, there is another "slight" error in that article: Instead of receiving $1bn in funding Gavin has only received:
Gavin wrote:[Response: For reference, that is $820,000 over 8 years (3 grants I think), and funded 4 graduate students, my salary and a couple of research associates. And note that 50% goes right off the top as overhead. Work out how big the lap of luxury it is that I was sitting in. - gavin]
As for the CRU deleting data: What they did was delete/throw away their copies of the data they received from the various stations, NMS, etc. The originals are still at those weather stations or with the various NMS. In effect, they received that data from various sources, put it together into a database and throw away their copies of the original data, as it was no longer needed. If you want to get the original data, ask those NMS, go to the various weather stations etc.
User avatar
Guardsman Bass
Cowardly Codfish
Posts: 9281
Joined: 2002-07-07 12:01am
Location: Beneath the Deepest Sea

Re: Hacked E-mails from Climate Scientists released

Post by Guardsman Bass »

You beat me to it, D.Turtle.
If you want to get the original data, ask those NMS, go to the various weather stations etc.
It probably would be worthwhile for CRU to do that at this point, and then publish the raw data, if only to clear up their name a bit and defend the adjustments they made to create their dataset. Other organizations are doing so; the National Institute for Water and Atmospheric Research (NIWA) in New Zealand just issued an explanation of why they adjusted their raw data-set, after they had been accused of tampering the data to make warming appear where there was none.
“It is possible to commit no mistakes and still lose. That is not a weakness. That is life.”
-Jean-Luc Picard


"Men are afraid that women will laugh at them. Women are afraid that men will kill them."
-Margaret Atwood
Gilthan
Youngling
Posts: 88
Joined: 2009-11-06 07:07am

Re: Hacked E-mails from Climate Scientists released

Post by Gilthan »

D.Turtle wrote:Doing the same with your new pictures results in these two graphs (the years and temperature scales fit as exactly as I can make them, exactly where to choose the starting point is a rough guess.
You don't even show a temperature scale on your larger overlay of the CRU graph, where it is on top of the UAH graph (leaving the UAH graph temperature scale but not that of the CRU graph) ... for good reason, as you've adjusted vertical compression of the former until a 0.5 degree change looks like a 0.3 degree change.

On your smaller overlay of the two, the 0.5 degree Celsius line and the CRU graph's scaling is still left, but that only makes it apparent, despite the blurriness and imperfection, that there is a tens of percent difference between the 0.3 degree Celsius trend line and the 0.5 degree Celsius marks.

In general, it is way more accurate to look directly at the graphs and measure them, not at a blurry overlay where you choose the hidden scaling (and where you even vary it between two overlays of the same pair of graphs). However, as I already posted an illustration doing so before on the prior page of this thread, showing even pixel measurements, there seems little point in going in circles repeating it.
User avatar
D.Turtle
Jedi Council Member
Posts: 1909
Joined: 2002-07-26 08:08am
Location: Bochum, Germany

Re: Hacked E-mails from Climate Scientists released

Post by D.Turtle »

I note that you are unable and/or unwilling to produce a set of graphs using equivalent, comparable methodology that has the same time-scale and temperature scale for the different sources of data.

Which leaves us with the following graph (that we started with), which uses comparable, equivalent methodology that has the same time and temperature scale for the various sources of data, to compare the different sets of data:
Image

Or, since you disagreed with that one we can take another one, that compares several different data sets:
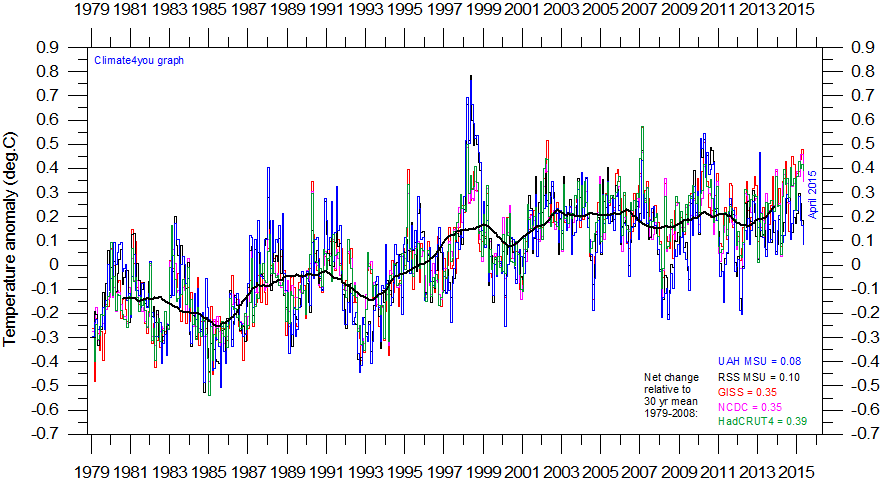
Climate4You wrote: Comparing global air temperature estimates

In order to enable a visual comparison of the five different global temperature estimates shown above, the diagram below show all series superimposed. As the base period differs for the different temperature estimates (see above), they are not directly comparable. All data series were therefore normalised by setting their starting value in January 1979 = 0, before inclusion in the diagram below. In addition to the visual analysis below, the reader might also find it useful to inspect the maturity analysis presented above.
Image
Superimposed plot of all five global monthly temperature estimates shown above, after setting January 1979 = 0. The two satellite-based temperature estimates (RSS MSU and UAH MSU) at the moment deviate from each other, with RSS MSU being the warmer. The three surface-based temperature estimates (HadCRUT3, GISS and NCDC) also show differences, but smaller. The numbers shown in the lower right represent the anomaly since January 1979 for the last month with data for all five series. See also the diagram below. Values are rounded off to the nearest two decimals, even though some of the the original data series come with more than two decimals. As the base period differs for the different temperature estimates, they have been normalised by setting all starting values in January 1979 = 0. Last month shown: October 2009. Last diagram update: 23 November 2009.
[R_H]
Sith Devotee
Posts: 2894
Joined: 2007-08-24 08:51am
Location: Europe

Re: Hacked E-mails from Climate Scientists released

Post by [R_H] »

Is it just me, or has the coverage of the emails etc been minimal in the print and television media? I've only seen a short segement on it on CNN (I think it was Political Mann), and it was extremely brief and something along the lines of: "Climate change institute's emails released on the web, some allege fraud". Has there been anything in the (West) European media about this?
Gilthan
Youngling
Posts: 88
Joined: 2009-11-06 07:07am

Re: Hacked E-mails from Climate Scientists released

Post by Gilthan »

D.Turtle wrote:Or, since you disagreed with that one we can take another one, that compares several different data sets:
Notice where that climate4you.com graph says UAH?

UAH stands for the satellites monitored by the University of Alabama in Huntsville, and their Earth System Science Center's director is John Christy.

So, let's not quote from a third-party source's adjustments of UAH data but rather from the head UAH director himself, conveniently from a government webpage here:

http://epw.senate.gov/107th/chr_0502.htm
Mr. Chairman and Committee Members, I am pleased to accept your invitation to speak to you again about climate change. I am John Christy, Professor of Atmospheric Science and Director of the Earth System Science Center at the University of Alabama in Huntsville. I am also Alabama's State Climatologist and recently served as one of the Lead Authors of the IPCC.

<snip>

A common feature of climate model projections of global average temperature changes due to enhanced greenhouse gasses is a rise in the temperature of the atmosphere from the surface to 30,000 feet the true bulk of the atmosphere. This temperature rise itself is projected to be significant at the surface, with increasing magnitude as one rises through this layer called the troposphere. Most people use the term Global Warming to describe this possible human-induced temperature rise.

Over the past 22-years various calculations of surface temperature do indeed show a rise between +0.52 and +0.63 F (0.29 and 0.35 C depending on which estimate is used.) This represents about half of the total surface warming since the 19th century. In the troposphere, however, the values, which include the satellite data Dr. Roy Spencer of NASA and I produce, show only a very slight warming between +0.00 and +0.15 F (+0.00 and +0.08 C) a rate less than a third that observed at the surface (Fig. 1). New evidence shown in Figs. 2 and 3 continues to show the remarkable consistency between independent measurements of these upper air temperatures.

Since the last time I testified before this committee, 1998 was above the long term average, but 1999 and 2000 were below. So, rather than seeing a warming over time that increases with altitude as climate models project, we see that in the real world the warming decrease substantially with altitude.

It is certainly possible that the inability of the present generation of climate models to reproduce the reality of the past 22+ years may only reflect the fact that the climate experiences large natural variations in the vertical temperature structure over such time periods. By recognizing this however, any attention drawn to the surface temperature rise over the past two decades must also acknowledge the fact that the bulk of the atmospheric mass has not similarly warmed.

<snip>

In the past 150 years, sea level has risen at a rate of 6 in. ñ 4 in. (15 cm ñ 10 cm) per century and is apparently not accelerating. Sea level also rose in the 17th and 18th centuries, obviously due to natural causes, but not as much. Sea level has been rising naturally for thousands of years (about 2 in. per century in the past 6,000 years). If we look at ice volumes of past interglacial periods and realize how slow ice responds to climate, we know that in the current interglacial period (which began about 11,000 years ago) there is still more land ice available for melting, implying continued sea level rise.

One of my duties in the office of the State Climatologist is to inform developers and industries of the potential climate risks and rewards in Alabama. I am very frank in pointing out the dangers of beach front property along the Gulf Coast. A sea level rise of 6 in. over 100 years, or even 50 years is minuscule compared with the storm surge of a powerful hurricane like Fredrick or Camille. Coastal areas threatened today will be threatened in the future. The sea level rise, which will continue, will be very slow and thus give decades of opportunity for adaptation, if one is able to survive the storms.

<snip>

I remember as a college student at the first Earth Day being told it was a certainty that by the year 2000, the world would be starving and out of energy. Such doomsday prophesies grabbed headlines, but have proven to be completely false. Similar pronouncements today about catastrophes due to human-induced climate change sound all too familiar and all too exaggerated to me as someone who actually produces and analyzes climate information.

Image

<snip>

Image

Image

<snip>
Bolding added. The above even includes a balloon to satellite comparison illustrating the consistency and accuracy of those measurements. The graphs end in 2001 since this was a 2001 testimony, so I'll refer back to how they correspond to the pre-2002 portion of this graph that extends later to 2008:

Image

The reference to models predicting greenhouse-gas-induced warming to be high at substantial altitude is due to the fundamental way GHGs work, absorbing infrared radiation in large part at those altitudes since the gas extends up there. The fact that observed tropospheric temperature changes are relatively low places some limits on the magnitude of GHG radiative forcing (suggesting the relatively weak direct effect of CO2 isn't being amplified as much by water vapor as the average traditional model assumes), not meaning there is no global warming but limiting its degree.

What one would expect to decrease with altitude, in contrast, is any surface temperature distortions like those suggested in the earlier article:

http://www.theregister.co.uk/2008/11/19 ... print.html
It became apparent that Hansen's code that adjusted for missing data (FILNET) had arbitrarily adjusted the 20th Century temperature trend upwards several times by 0.1°C at regular intervals - with no explanation.

<snip>

In addition, NOAA's adjustment for Urban Heat Island (UHI) over the entire 20th century is an insignificant -0.06°C. Yet papers by McKitrick and Michaels [abstract - background] and by LaDochy et al [abstract] in late 2007 indicate that NASA and NOAA adjustment methods may exaggerate warming trends by a factor of two. (LaDochy estimates UHI trends are x2 during the day and x5 at night. If true, current UHI adjustment is too small.)
User avatar
D.Turtle
Jedi Council Member
Posts: 1909
Joined: 2002-07-26 08:08am
Location: Bochum, Germany

Re: Hacked E-mails from Climate Scientists released

Post by D.Turtle »

You'll note that that testimony is from 2001, aka before an independent group in 2005 did an independent analyses of the satellite data and received very different results.

They even figured out why, leading UAH to revise their complete temperature record and increasing the decadal trend in their data set from 0.088°C per decade (hey, I finally know where you got that number from) to 0.123°C.

That is a fucking 40% increase in the trend!

And for some reason you continually use this DEBUNKED, REVISED, OUTDATED, USELESS number all the time.

Gee, I wonder why.

In fact, I am 100% sure that if the revision had been the opposite (aka down instead of up), you would declare all that data invalid and the group useless and use only the data from the group that was actually capable and competent enough to find the flaws in the fucked up data set they had.

But since it was the way it was (aka the revision was up and their data is still below everyone else, while the group that was competent enough to find the flaws in their analyses shows higher temperatures), you not only continue to use their data, but you consistently use their trends from BEFORE the revision, even after I repeatedly showed you that they now have a trend much more in line with the rest (0.13°C per decade).

So, what does the group that was actually able (and competent enough) to find the fucking HUGE, MAJOR flaw in the UAH analysis of the satellite say?

Here is the paper describing the independent analysis of the UAH data that led to their adjustment:
The Effect of Diurnal Correction on Satellite-Derived Lower Tropospheric Temperature wrote:
The Effect of Diurnal Correction on Satellite-Derived Lower Tropospheric Temperature
Carl A. Mears and Frank J. Wentz

Satellite-based measurements of decadal-scale temperature change in the lower troposphere have indicated cooling relative to Earth's surface in the tropics. Such measurements need a diurnal correction to prevent drifts in the satellites' measurement time from causing spurious trends. We have derived a diurnal correction that, in the tropics, is of the opposite sign from that previously applied. When we use this correction in the calculation of lower tropospheric temperature from satellite microwave measurements, we find tropical warming consistent with that found at the surface and in our satellite-derived version of middle/upper tropospheric temperature.
Emphasis mine.

Heres the press release from UAH when they had to correct the major flaw:
UAH Press release wrote:California group's answer to climate puzzler improves the accuracy of global climate data
(8/11/2005)

A curious puzzle in the study of climate science has been solved, and that solution is helping scientists at The University of Alabama in Huntsville (UAH) make the satellite record of global climate change more reliable than it was previously.

Research published this week by Carl Mears and Frank Wentz of Remote Sensing Systems (RSS) in Santa Rosa, Calif., identifies a problem that kept the UAH group from accurately correcting one error caused by NOAA satellites drifting in their orbits over the past 26 years.

The net result of changes in how the data are analyzed added about 0.09 C (about 0.16 degrees Fahrenheit) of global warming over the past 26 years, with most of that previously unreported warming occurring in the tropics.

"This work helps us produce a climate record that is even more reliable than it has been," said Dr. John Christy, director of UAH's Earth System Science Center.

Previously, the long-term (December 1978 through July 2005) climate trend in the UAH satellite dataset showed average global warming at the rate of about 0.88 C (about 1.58 degrees Fahrenheit) per century. The new trend, which includes the extra warming in the tropics, shows average global warming at the rate of about 1.23 C (about 2.21 degrees Fahrenheit) per century.
Here's an article from UAH describing the difference their adjustments made:
Temperature Trends in the Lower Atmosphere - Understanding and Reconciling Differences wrote: Abstract
Previously reported discrepancies between the amount of warming
near the surface and higher in the atmosphere have been used to
challenge the reliability of climate models and the reality of humaninduced
global warming. Specifically, surface data showed substantial
global-average warming, while early versions of satellite and radiosonde
data showed little or no warming above the surface. This significant
discrepancy no longer exists because errors in the satellite and
radiosonde data have been identified and corrected. New data sets
have also been developed that do not show such discrepancies.
So, how about you fucking STOP using outdated, useless data, shithead.

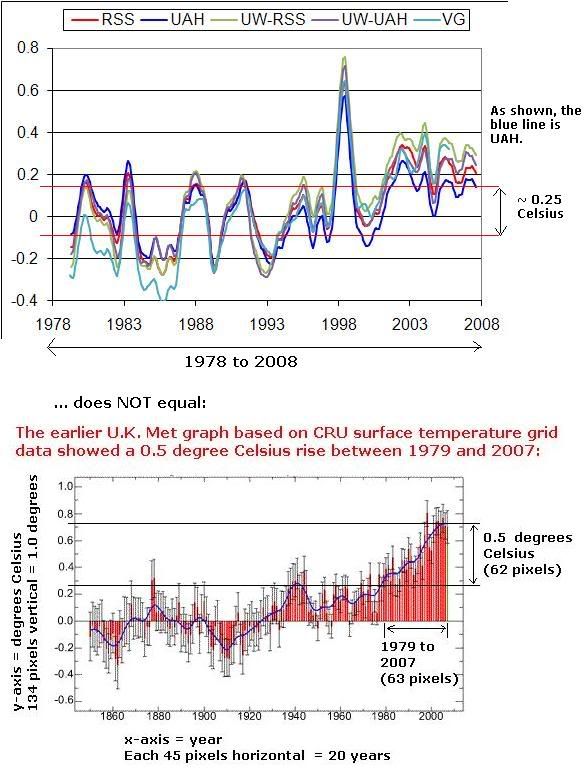
Oh, and here is another independent comparison of various data sets:
Image
Gilthan
Youngling
Posts: 88
Joined: 2009-11-06 07:07am

Re: Hacked E-mails from Climate Scientists released

Post by Gilthan »

The one of those from UAH itself, as opposed to third-parties, is just the 0.09 Celsius adjustment and not at all latitudes, only a small adjustment. (Balloon data had already shown it was primarily close to accurate).
The net result of changes in how the data are analyzed added about 0.09 C (about 0.16 degrees Fahrenheit) of global warming over the past 26 years, with most of that previously unreported warming occurring in the tropics.

"This work helps us produce a climate record that is even more reliable than it has been," said Dr. John Christy, director of UAH's Earth System Science Center.
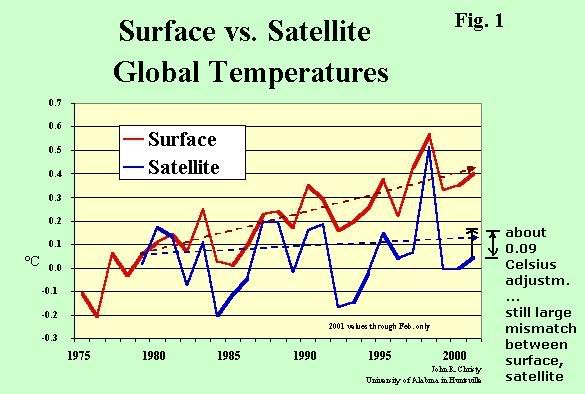
In Dr. Christy's graph, a 0.09 degree Celsius slight adjustment at some latitudes doesn't change the full magnitude of the far greater difference:

http://epw.senate.gov/107th/christy_1.gif

Image

You'd know that if you could read the graph and its temperature markings. Sure, it is older, but that doesn't matter for the overall picture.
D.Turtle wrote:Oh, and here is another independent comparison of various data sets:
Image
Since you can't read the scales on graphs, you don't understand that your very own graph is supporting my point about it not matching the CRU surface temp graph, but I'll make it obvious:

Image

Again, you won't even comprehend how to read and compare these graphs, but, for those who can, it is pretty easy to see where the lines intersect the temperature scales on the left and the huge difference (short of, again, meaningless bias by the 1998 PDO+El Nino year).

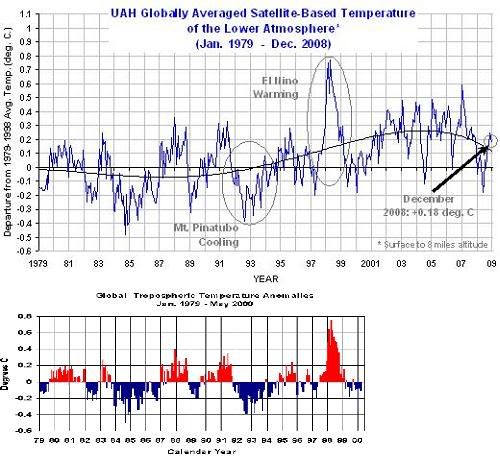
Such is, of course, like the earlier graph I posted on data straight from the current up-to-date http://climate.uah.edu/dec2008.htm page.
Gilthan
Youngling
Posts: 88
Joined: 2009-11-06 07:07am

Re: Hacked E-mails from Climate Scientists released

Post by Gilthan »

Since you make a big deal about the slight adjustments since 2001 which don't really change the overall picture, I found later 2009 testimony, again from Dr. John Christy, the head of the UAH department, the very individual your one quote from UAH directly had mentioning the tiny 0.09 Celsius mid-latitude adjustment in 2005:

http://waysandmeans.house.gov/media/pdf/111/ctest.pdf
Overstated warming in surface temperature datasets

Surface temperatures in the few popular global datasets are often used as a proxy for global warming. Let me say I’m one of the few in this science who actually builds climate datasets from scratch. In several published papers I and others have shown that we have found two serious problems, somewhat related, that strongly suggest the warming of the past century is overstated.

First, the use of a few popular stations for which the data are easy to find, leads to too much warming when the averages are constructed. I have published research for North Alabama, Central California and in a few months East Africa, in which I went back to the original sources of data to augment the number of stations by roughly a factor of ten – indeed, ten times more stations. This effort requires significant time in searching for and manually digitizing the records for scientific purposes. In each case, I’ve found that the data sets based on a few popular stations overstate the warming by up to a factor of three. (Christy 2002, Christy et al. 2006, Pielke et al. 2007, Christy et al 2009)

Secondly, we have demonstrated in several publications that as humans develop the surface through agriculture, urbanization and so on, that this leads, by complicated physical processes, to higher nighttime temperatures over time, but which are unrelated to CO2 emissions. Thus, the current, popular land-based mean surface temperature charts, which average the nighttime and daytime temperatures, and which are often shown to demonstrate warming, overstate the actual warming of the basic atmosphere. (Christy 2001, Christy et al. 2006, Christy et al. 2007, Pielke et al. 2007, Christy et al 2009).

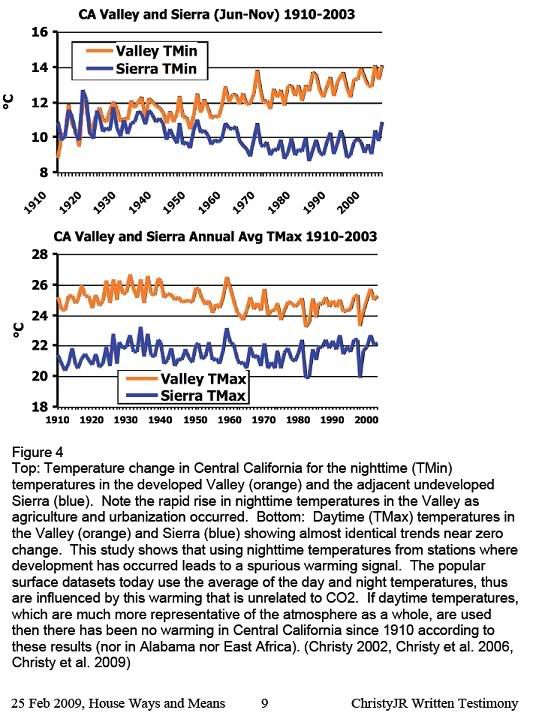
Figure 4 shows the very different impact of surface development on daytime and night time temperatures in the example from Central California. Detailed temperature reconstructions were generated for the developed San Joaquin Valley of California as well as the adjacent foothills of the Sierra. The daytime temperatures of both regions show virtually no change over the past 100 years, while the nighttime temperatures indicate the developed Valley has warmed significantly while the undeveloped Sierra foothills have not.

The popular land-surface temperature datasets average both day and night temperatures which means the contamination by surface development of the night time temperatures in all likelihood overstates the actual temperature change which is then erroneously attributed to the effects of increased CO2 concentrations. (Christy et al. 2006, 2009).
http://waysandmeans.house.gov/media/pdf/111/ctest.pdf
Gilthan
Youngling
Posts: 88
Joined: 2009-11-06 07:07am

Re: Hacked E-mails from Climate Scientists released

Post by Gilthan »

Last but not least, those who followed the nuclear winter climatology debate may see a similar pattern repeated here:

http://waysandmeans.house.gov/media/pdf/111/ctest.pdf
My colleague Dr. Roy Spencer has shown that in the real world – the world of observations from satellites - that during warming episodes, clouds respond by stepping up their cooling effect (the basic effect of clouds is the cool the climate already). When climate model output calculated in the same way is compared with observations, not one model mimics this cooling effect – in fact the models’ clouds lead to further warming, not cooling as it is in nature. We hypothesize that this poor representation of clouds in models is the reason we find the warming rates of model projections to have significantly overshot what has actually happened. (Christy et al. 2007, Spencer and Braswell, 2008, Christy and Norris 2009, Spencer and Braswell, to be submitted)

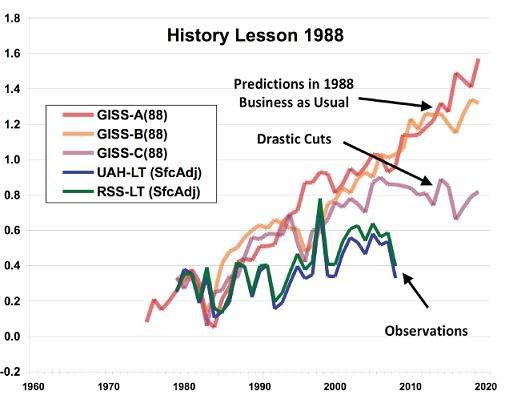
Figure 2 demonstrates that the projections made in 1988 of rapid temperature rises, based on a climate model which assumed high sensitivity to CO2, overshot the actual temperature trend by a significant amount.

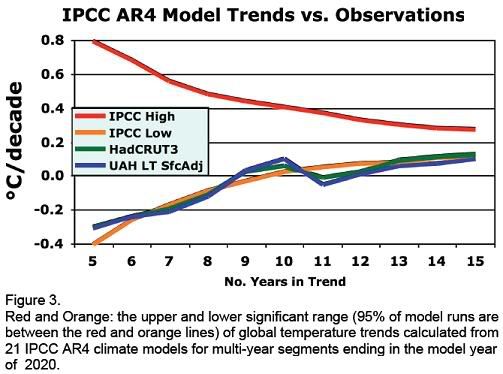
Figure 3 indicates the most recent set of climate models is not faring any better. Surface temperature trends for various segment length from the most recent 5 years to 15 years shows that the observations are coming in at the lowest edge of the 95% range of the latest climate model projections, which is consistent with the statement that the mid-range of “best estimate” model simulations is too sensitive to CO2.
Copied from the http://waysandmeans.house.gov/media/pdf/111/ctest.pdf file, here's the figure 2 illustration of models versus reality:

Image

And one can go to the pdf file to see figure 3 for later models too, a good read in general.
User avatar
D.Turtle
Jedi Council Member
Posts: 1909
Joined: 2002-07-26 08:08am
Location: Bochum, Germany

Re: Hacked E-mails from Climate Scientists released

Post by D.Turtle »

The first link I posted was the peer-reviewed article that lead to the correction of the UAH satellite dataset.

The second link I posted was the press release announcing the revision and its effects (total of 0.09°C more warming, leading to a 40% increase in the decadal trend to 0.123°C per decade).

The third link I posted was an article describing the effects of the revision. It's lead authors etc were:
Convening Lead Author: Tom M. L. Wigley, NSF NCAR
Lead Authors: V. Ramaswamy, NOAA;
J.R. Christy, Univ. of AL in Huntsville;
J.R. Lanzante, NOAA;
C.A. Mears, Remote Sensing Systems;
B.D. Santer, DOE LLNL; C.K. Folland, U.K. Met Office
Emphasis mine. Now, who is J.R. Christy, Univ. of AL in Huntsville? Lets quote that UAH press release from before:
"This work helps us produce a climate record that is even more reliable than it has been," said Dr. John Christy, director of UAH's Earth System Science Center.
Third party indeed.

And quoting (once again), the UAH page you posted:
Global Temperature Report: December 2008

Global trend since Nov. 16, 1978: +0.13 C per decade
How does this compare to other sources?

Quoting RealClimate:
A Warming Pause? wrote:Global temperature according to NASA GISS data since 1980. The red line shows annual data, the larger red square a preliminary value for 2009, based on January-August. The green line shows the 25-year linear trend (0.19 ºC per decade). The blue lines show the two most recent ten-year trends (0.18 ºC per decade for 1998-2007, 0.19 ºC per decade for 1999-2008)
And for for a few more, quoting from Table 3.3 in Chapter 3 of the Working Group 1 of the Fourth Assessment Report of the IPCC:
Chapter 3, Working Group 1 (pdf) wrote: Temperature Trend (°C per decade):
Dataset 1979–2005
Globe
CRU/UKMO (Brohan et al., 2006) 0.163 ± 0.046
NCDC (Smith and Reynolds, 2005) 0.174 ± 0.051
GISS (Hansen et al., 2001) 0.170 ± 0.047
And adding the new stuff you posted:
Gilthan wrote:Since you make a big deal about the slight adjustments since 2001 which don't really change the overall picture, I found later 2009 testimony, again from Dr. John Christy, the head of the UAH department, the very individual your one quote from UAH directly had mentioning the tiny 0.09 Celsius mid-latitude adjustment in 2005:
Once again, 0.09°C of warming over 26 years, leading to a 40% increase in the decadal trend is not "slight". In contrast, there was a "huge" blowup (in the skeptic community) in 2007 about GISTEMP accidentally showing a too large trend because of an error in a correction algorithm. Correcting this mistake resulted in a ~0.003°C correction. Bias much?

Looking through that Congressional Testimony from Christy:
Overstated warming in current climate models and surface data sets
Current climate model projections assume that climate is very sensitive to CO2. We’ve found however, that during warming episodes, clouds step up their cooling effect. When model output is tested this way, not one model mimics this cooling effect – in fact the models’ clouds lead to further warming, not cooling as seen in nature. We hypothesize that poor cloud properties cause models to overstate warming rates. We’ve also found that current popular surface temperature datasets indicate more warming than is actually happening in the atmosphere because they are contaminated by surface development.
LARGE IMAGE
That is figure SPM-2 from the Fourth Assessment Report. See those blue bars of Radiative Forcing at "Cloud albedo effect". See the LOSU at the right saying "Low"? What this means is two things: First of all, it is well known that Cloud cover can have a cooling effect. The question is of magnitude. Which is where further research comes in. The Assessment Reports also try to identify areas where more research has to be done in order to achieve better understanding of the science. Thats how science works. Pointing at an area where it is understood that the current knowledge is lacking and concluding from that, that the entire thing is useless is worse than disingenuous.

Which lead us to the next part:
Figure 2 demonstrates that the projections made in 1988 of rapid temperature rises, based on a climate model which assumed high sensitivity to CO2, overshot the actual temperature trend by a significant amount.
Ok, so models made in 1988 being not perfect makes models made in 2009 not perfect, because there is no difference, right? Let's take a look at what models in 1988 (First Assessment Report looked like in comparison to models today):
LARGE IMAGE
Thats figure 1-2 of the Report of Working Group 1 of the IPCC showing (in pcitures) the difference between the varying generations of climate models.
Also, isn't it interesting that he doesn't mention the Second or Third Assessment Report? Gee, I wonder why:
LARGE IMAGE

Continuing on:
Figure 3 indicates the most recent set of climate models is not faring any better. Surface temperature trends for various segment length from the most recent 5 years to 15 years shows that the observations are coming in at the lowest edge of the 95% range of the latest climate model projections, which is consistent with the statement that the mid-range of “best estimate” model simulations is too sensitive to CO2.
So they are still in the range.

Also looking at his caption of figure 3, there is something very interesting thing:
The two main points here are (1) the observations are much cooler than the mid-range of the model spread and are at the minimum of the model simulations and (2) the satellite adjustment for surface comparisons is exceptionally good. The implication of (1) is that the best estimates of temperature trends of the IPCC models are too warm, or that they are too sensitive to CO2 emissions.
Emphasis mine. Aren't you arguing the opposite? So you are now contesting the trend estimates coming out from UAH AND you are contesting what the director of UAH's Earth System Science Center is saying - that satellite and surface measurement are in agreement.

Continuing on:
Figure 4 shows the very different impact of surface development on daytime and night time temperatures in the example from Central California. Detailed temperature reconstructions were generated for the developed San Joaquin Valley of California as well as the adjacent foothills of the Sierra. The daytime temperatures of both regions show virtually no change over the past 100 years, while the nighttime temperatures indicate the developed Valley has warmed significantly while the undeveloped Sierra foothills have not. The popular landsurface temperature datasets average both day and night temperatures which means the contamination by surface development of the night time temperatures in all likelihood overstates the actual temperature change which is then erroneously attributed to the effects of increased CO2 concentrations. (Christy et al. 2006, 2009).
But didn't he just say that satellite (which presumably adjust for that effect) and surface temperatures are in agreement?

Also, the Urban Heat Island effect is very well known and is adjusted for. For example for the GISTEMP dataset the following is done:
GISTEMP wrote:The GHCN/USHCN/SCAR data are modified in two steps to obtain station data from which our tables, graphs, and maps are constructed. In step 1, if there are multiple records at a given location, these are combined into one record; in step 2, the urban and peri-urban (i.e., other than rural) stations are adjusted so that their long-term trend matches that of the mean of neighboring rural stations. Urban stations without nearby rural stations are dropped.
User avatar
Korgeta
Padawan Learner
Posts: 388
Joined: 2009-10-24 05:38pm

Re: Hacked E-mails from Climate Scientists released

Post by Korgeta »

I thought the main argument from the sceptics is not that global warming/change exists as it has occured many times in human history but that man's contribution to global warming is not as severe as those who support global warming make it out to be? It is something that needs to be cleared up. Forcing out ideas like biofuel is causing more harm then good. Less Co2 or whatever but the deforesting and displacing agriculture has severe effects for a already near overpopulated world. We do have to switch from oil sooner or later, even the oil companies know that. It is whever the policies for renewable energy (that will be costly to the tax payer) is worth it for the average person who does the recyling and if such renewable means really do make a difference. And as the latest update shows, the fact that leaked private emails from the heads of the IPCC have come into question will throw into doubt the international co-operation on limiting greenhouse gas emissions. Next week will be a very intresting week indeed.

http://news.bbc.co.uk/1/hi/sci/tech/8394483.stm
User avatar
Formless
Sith Marauder
Posts: 4144
Joined: 2008-11-10 08:59pm
Location: the beginning and end of the Present

Re: Hacked E-mails from Climate Scientists released

Post by Formless »

Korgeta wrote:I thought the main argument from the sceptics is not that global warming/change exists as it has occured many times in human history but that man's contribution to global warming is not as severe as those who support global warming make it out to be?
That's only one of their (more reasonable, if we're being generous) arguments, but its by far not the only one. Two other common (and highly aggravating) arguments you'll come across are accusations of conspiracy (which tend to be about as credible as the conspiracy theories claiming the Apollo missions were a hoax or that aliens walk among us) or outright appealing to ignorance and claiming it isn't happening at all. But then, for most skeptics the real reason they dismiss global warming isn't the one they're going to admit to or use in an argument; its because they have a political agenda that has no room for taking responsibility for man's impact on the environment, or even man's future on this earth. Maybe 1% of them honestly care about the science behind the debate, while the rest are comfortable in their apathy.
"Still, I would love to see human beings, and their constituent organ systems, trivialized and commercialized to the same extent as damn iPods and other crappy consumer products. It would be absolutely horrific, yet so wonderful." — Shroom Man 777
"To Err is Human; to Arrr is Pirate." — Skallagrim
“I would suggest "Schmuckulating", which is what Futurists do and, by extension, what they are." — Commenter "Rayneau"
The Magic Eight Ball Conspiracy.
Gilthan
Youngling
Posts: 88
Joined: 2009-11-06 07:07am

Re: Hacked E-mails from Climate Scientists released

Post by Gilthan »

D.Turtle wrote:
Dr. John Christy, director of UAH's Earth System Science Center.
Yes, the expert quoted several posts ago as pointing out:

Code: Select all

"I remember as a college student at the first Earth Day being told it was a certainty that by the year 2000, the world would be starving and out of energy. Such doomsday prophesies grabbed headlines, but have proven to be completely false. Similar pronouncements today about catastrophes due to human-induced climate change sound all too familiar and all too exaggerated to me as someone who actually produces and analyzes climate information."
http://epw.senate.gov/107th/chr_0502.htm
D.Turtle wrote:Third party indeed.
I'm not sure whether you simply don't read or use the assumption that others only skim-read as an argumentative tactic. Obviously I referred to the ones other than UAH as third-party, not UAH itself, and I went on to quote Dr. Christy, as easily seen by scrolling up.
D.Turtle wrote:How does this compare to other sources?

Quoting RealClimate:
A Warming Pause? wrote:Global temperature according to NASA GISS data since 1980. The red line shows annual data, the larger red square a preliminary value for 2009, based on January-August. The green line shows the 25-year linear trend (0.19 ºC per decade).
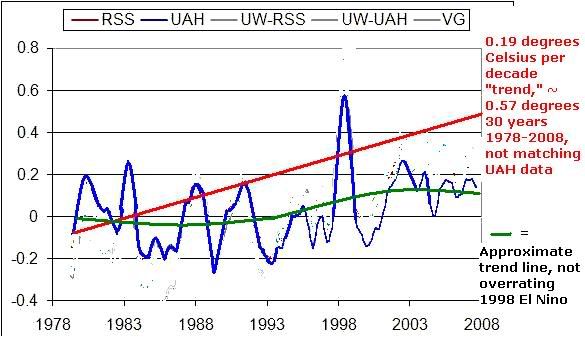
You're about as honest as the average individual writing up this when you say the UAH data matches a 0.19 ºC per decade trend line. I'll make it even more obvious with this illustration:

Image

It is not perfect as I'm not going to spend hours on this, but it is yet good enough to make the large mismatch blatant. As obvious, it is the same as your own earlier graph seen scrolling up a bit in the thread, except with the non-UAH curves removed and a 0.19 degree per decade (0.57 degrees per 30 years) "trend" line added for comparison.
D.Turtle wrote:Once again, 0.09°C of warming over 26 years, leading to a 40% increase in the decadal trend is not "slight".
This is Dr. Christy's earlier graph if I add an edit showing how the bulk of the mismatch remains after a 0.09 degree Celsius adjustment:

Image
D.Turtle wrote:In contrast, there was a "huge" blowup (in the skeptic community) in 2007 about GISTEMP accidentally showing a too large trend because of an error in a correction algorithm. Correcting this mistake resulted in a ~0.003°C correction.
No, the following pointed out before is rather among prime points of dispute, not anything so tiny:

http://www.theregister.co.uk/2008/11/19 ... print.html
It became apparent that Hansen's code that adjusted for missing data (FILNET) had arbitrarily adjusted the 20th Century temperature trend upwards several times by 0.1°C at regular intervals - with no explanation.

<snip>

Yes, GISS-adjusted historical data matches fairly well with that of the NOAA. But NOAA 20th century raw data trend is adjusted upwards by about 0.3°C. Missing data fill-in (FILNET) and Station history adjustment (SHAP) are both upward. But common sense tells us that the former should be near-neutral (interpolation) and the latter downward (poor station siting and urban creep having introduced often severe warming biases over the years).

In addition, NOAA's adjustment for Urban Heat Island (UHI) over the entire 20th century is an insignificant -0.06°C. Yet papers by McKitrick and Michaels [abstract - background] and by LaDochy et al [abstract] in late 2007 indicate that NASA and NOAA adjustment methods may exaggerate warming trends by a factor of two. (LaDochy estimates UHI trends are x2 during the day and x5 at night. If true, current UHI adjustment is too small.)


<snip>

Hansen's role as the director in charge of the evidence of climate change has also caused controversy. It was Hansen who gave the issue national prominence during the 1988 Senate hearings. Recently he has urged trials for "climate criminals" - energy executives who disagree with his hypothesis and policy prescription (for Hansen has both). Hansen traveled to England to testify for the defence of environmental activists who vandalized a coal power station.
D.Turtle wrote:First of all, it is well known that Cloud cover can have a cooling effect. The question is of magnitude.
Magnitude is everything here. To repeat what I said before in my very first post in this thread:

As illustrated, there has been up to a 0.1 - 0.2 degree overall temperature increase over the past 30 years, as measured by the most reliable source of satellite measurements. Some predict 6 degrees Celsius temperature rise over the next 91 years, by the year 2100, although there's still some debate over the accuracy of the models giving the more exciting predictions widely reported in the popular media. (That CO2 causes some warming is not in doubt by any reputable scientist, but the exact magnitude of its warming effect when it interacts with water vapor feedback is complicated, among other factors).
D.Turtle wrote:Continuing on:
Figure 3 indicates the most recent set of climate models is not faring any better. Surface temperature trends for various segment length from the most recent 5 years to 15 years shows that the observations are coming in at the lowest edge of the 95% range of the latest climate model projections, which is consistent with the statement that the mid-range of “best estimate” model simulations is too sensitive to CO2.
So they are still in the range.
Only because the lower end of the range is multiple times less than the upper end of the range:

Image

http://waysandmeans.house.gov/media/pdf/111/ctest.pdf

A degree or two temperature rise by 2100 is a lot different from "high end" estimates like 6 degrees Celsius presented as fact as common popular media.
D.Turtle wrote:you are contesting what the director of UAH's Earth System Science Center is saying - that satellite and surface measurement are in agreement.
No, Dr. Christy, the director of UAH, is the one who made the earlier "Surface vs Satellite Global Temperatures" graph showing the general mismatch.

http://epw.senate.gov/107th/christy_1.gif

Image

... which, if a slight adjustment of 0.09 Celsius is shown, becomes the graph earlier in this particular post.

Some surface temp data matches satellite data, more often that for the oceans where too-poor corrections for urban heat island effects are not applicable. I used an ocean surface temp graph in an earlier post to show the lack of warming in the past decade.

Having bolded a quote a little earlier on urban heat island effects versus the degree of adjustment, I'll skip repeating it here.

But, reproducing figure 4 to better make obvious your efforts to mischaracterize it:

Image

http://waysandmeans.house.gov/media/pdf/111/ctest.pdf

As Dr. Christy said:
Surface temperatures in the few popular global datasets are often used as a proxy for global warming. Let me say I’m one of the few in this science who actually builds climate datasets from scratch. In several published papers I and others have shown that we have found two serious problems, somewhat related, that strongly suggest the warming of the past century is overstated.

First, the use of a few popular stations for which the data are easy to find, leads to too much warming when the averages are constructed. I have published research for North Alabama, Central California and in a few months East Africa, in which I went back to the original sources of data to augment the number of stations by roughly a factor of ten – indeed, ten times more stations. This effort requires significant time in searching for and manually digitizing the records for scientific purposes. In each case, I’ve found that the data sets based on a few popular stations overstate the warming by up to a factor of three.(Christy 2002, Christy et al. 2006, Pielke et al. 2007, Christy et al 2009)
The UAH satellite data, in contrast, isn't concentrated around the few percent of earth's surface area most subjected to urban and agricultural changes by humans, and, like sea surface temperature measurements of the 70% of the planet covered by oceans, it shows a lesser temperature change than the two popular Jones-CRU and Hansen-GISS land surface station grid datasets.
D.Turtle wrote:Thats how science works. Pointing at an area where it is understood that the current knowledge is lacking and concluding from that, that the entire thing is useless is worse than disingenuous.
Don't strawman this as science versus non-science. There are two main land surface temperature datasets, one under the direction of Professor Jones at CRU (until he had to recently step down pending the current investigation), the other under the direction of Hansen at GISS, who doesn't even pretend to be other than an extreme environmentalist, hardly guaranteed to be unbiased. Those versus the rather different results and conclusions of such as Dr. Christy at UAH are the matter here.

By the way, science is based on reproducible results and independent review, not Jones "accidentally" deleting raw data and both him & Hansen refusing to release it.
User avatar
D.Turtle
Jedi Council Member
Posts: 1909
Joined: 2002-07-26 08:08am
Location: Bochum, Germany

Re: Hacked E-mails from Climate Scientists released

Post by D.Turtle »

I could spend another few hours debunking all of your repetitive bullshit, but it has been obvious that isn't going to lead to anything.

Fact is, I have repeatedly shown that various repeated global temperature averages agree to a large extent on the fact that the globe is warming and to what extent. Instead of using current, properly revised, data from UAH you continue to use outdated sources and try to argue that the differences are not important, when the UAH themselves say differently.

You have gone over to simply adopting creationist tactics of flinging shit at the problem in the hope that something sticks. Things like quoting senate hearings from 2001, when you well knew that there was a major revision of the data in 2005 invalidating that stuff - as stated by the UAH itself. Things like declaring that the CRU deleted irreplaceable data - which is false, as the data is (and always was) in the hands of the various NMS. Things like quoting vague "when I was in college there was some guy who said we will all die and thus climate science is false" bullshit (paraphrase). I'm surprised you haven't trotted out global cooling, or Antarctica supposedly not warming, or glaciers supposedly not shrinking, or another of the various bullshit debunked claims propagated by the self-styled global warming "skeptics".

99% of the bullshit you propagate has been addressed by the IPCC in the Fourth Assessment Report. Things like the difference in global temperatures between various datasets, uncertainties in the models and the predictions, etc. Yet you act like finding some tiny difference or inconsistency throws into question everything that has been found factual in climate science, when these uncertainties are specifically addressed in that same report.

So at this time I am ending my part of this debate against you, as I am not masochistic enough to continue running headlong into a Wall of Ignorance.

Read the IPCC report, especially the Report of Working Group 1. To get even more up-to-date information (though not going through the extreme validation tests etc done by the IPCC), read the Copenhagen Diagnosis.

Anybody who claims that Climate Science is not Science has obviously not done so.
Gilthan
Youngling
Posts: 88
Joined: 2009-11-06 07:07am

Re: Hacked E-mails from Climate Scientists released

Post by Gilthan »

D.Turtle wrote:Instead of using current, properly revised, data from UAH you continue to use outdated sources and try to argue that the differences are not important, when the UAH themselves say differently.
As repeatedly pointed out before, figures straight from the current webpage up through last year's data can be seen at the end of http://climate.uah.edu/dec2008.htm ... and graphing them results in the graph shown before.

That corresponds to your own graph (though, like usual, you didn't actually read the numbers on your graph). Such became the following when all but the UAH lines were removed and trend lines added for approximately what trend line the satellite data showed, versus in contrast the 0.19 degrees Celsius per decade "trend" claimed by your realclimate.org quote:

Image

UAH has two different figures for the fraction of a degree per decade Celsius rise given on different parts of their website, probably because the UAH website is written by more than one author, but the graph shows the overall picture, short of relatively meaninglessly overrating the 1998 El Nino year.
D.Turtle wrote:Fact is, I have repeatedly shown that various repeated global temperature averages agree to a large extent on the fact that the globe is warming and to what extent
Prof. Jones's CRU and Hansen's GISS surface temperature station data (too concentrated around human land use changes and not well enough adjusted for them), versus UAH satellite data, have in common that there has been some global warming. However, as repeatedly illustrated, claims like 0.5-0.6 degrees Celsius of warming over the past 30 years based on the former don't match the more reliable satellite data that shows under 0.2 degrees Celsius real rise over that period.

Such is of relevance to how likely are estimates like the 6 degree Celsius rise over the next 90 years to 2100 commonly claimed in the popular press.

A good summary of part of this:

http://money.cnn.com/2009/05/14/magazin ... /index.htm
With Congress about to take up sweeping climate-change legislation, expect to hear more in coming weeks from John Christy, director of the Earth System Science Center at University of Alabama-Huntsville.

A veteran climatologist who refuses to accept any research funding from the oil or auto industries, Christy was a lead author of the 2001 Intergovernmental Panel on Climate Change report as well as one of the three authors of the American Geophysical Union's landmark 2003 statement on climate change.

Yet despite those green-sounding credentials, Christy is not calling for draconian cuts in carbon emissions. Quite the contrary. Christy is actually the environmental lobby's worst nightmare - an accomplished climate scientist with no ties to Big Oil who has produced reams and reams of data that undermine arguments that the earth's atmosphere is warming at an unusual rate and question whether the remedies being talked about in Congress will actually do any good.

His most controversial argument is that the surface temperature readings upon which global warming theory is built have been distorted by urbanization. Due to the solar heat captured by bricks and pavement and due to the changing wind patterns caused by large buildings, a weather station placed in a rural village in 1900 will inevitably show higher temperature readings if that village has, over time, been transformed into small city or a suburban shopping district, Christy says.

The only way to control for such surface distortions is by measuring atmospheric temperatures. And when Christy and his co-researcher Roy Spencer, a former NASA scientist now teaching at UA-Huntsville, began analyzing temperature readings from NOAA and NASA satellites, they found much slighter increases in atmospheric temperatures than what was being recorded on the surface. Christy and Spencer also found that nearly all the increases in average surface temperatures are related to nighttime readings
Post Reply