D.Turtle wrote:Now, what evidence is there that leads to such a conclusion?
<snip>
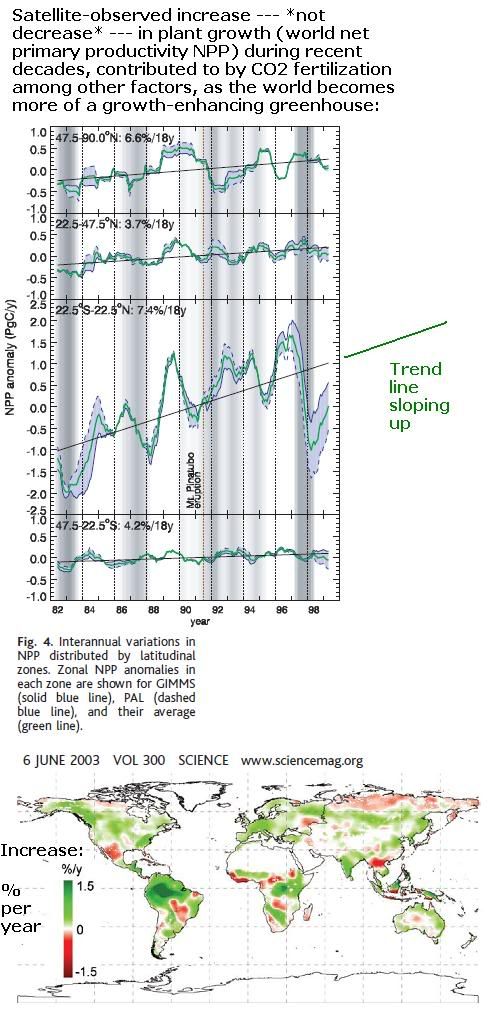
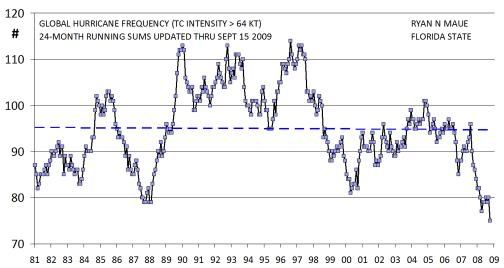
You seriously thought you could refute the *global* graph of hurricane trends in my last post with an *Atlantic-only* graph?
You get a substantial increase only by looking at just one particular region's fluctuations over a few year period. Over the decades there has been simultaneous increase in some regions and decrease in others. If cherry-picking local data was how to do analysis (no!), I could disprove global warming by just choosing a local region that had cooling over the past century, as there is always regional variation in any part of the climate, from land to sea surface temperatures.
To add to the earlier *global* illustration, let's point out what a global study finds:
http://www.agu.org/pubs/crossref/2006/2 ... 5881.shtml
Trends in global tropical cyclone activity over the past twenty years (1986–2005)
The data indicate a large increasing trend in tropical cyclone intensity and longevity for the North Atlantic basin and a considerable decreasing trend for the Northeast Pacific. All other basins showed small trends, and there has been no significant change in global net tropical cyclone activity. There has been a small increase in global Category 4–5 hurricanes from the period 1986–1995 to the period 1996–2005. Most of this increase is likely due to improved observational technology.
Also the local Atlantic sea temperature trend over the short few years at the end is as atypical as the rest compared to global temperatures instead. Variation between different regions is well illustrated over a longer 1950-2000 period in a Journal of Physical Oceanography paper:
Is the World Ocean Warming? Upper-Ocean Temperature Trends: 1950–2000.
D.Turtle wrote:For example, the IPCC says it is "likely" that increased CO2 emissions will lead to "Intense tropical cyclone activity increases". Likely means a 66%-90% certainty at that time. Note, that this is a progection - not related to what has happened up to that time.
Indeed it is far from 100% proven and not at all related to what has actually happened up to this time during the past hundred years of global warming. Personally, I like to look at the past 100 years to gain some historically grounded ideas of the next 50 years.
As Dr. Spencer of the UAH and project team leader of NASA's Aqua satellite radiometer program points out in a good summary of debate even on the very future temperature trend assumptions underlying such predictions:
http://www.drroyspencer.com/global-warming-101/
Dr. Spencer of UAH wrote:Now, you might be surprised to learn that the amount of warming directly caused by the extra CO2 is, by itself, relatively weak. It has been calculated theoretically that, if there are no other changes in the climate system, a doubling of the atmospheric CO2 concentration would cause less than 1 deg C of surface warming (about 1 deg. F). This is NOT a controversial statement…it is well understood by climate scientists. (As of 2008, we were about 40% to 45% of the way toward a doubling of atmospheric CO2.)
BUT…everything this else in the climate system probably WON’T stay the same! For instance, clouds, water vapor, and precipition systems can all be expected to respond to the warming tendency in some way, which could either amplify or reduce the manmade warming. These other changes are called “feedbacks,” and the sum of all the feedbacks in the climate system determines what is called ‘climate sensitivity’. Negative feedbacks (low climate sensitivity) would mean that manmade global warming might not even be measurable, lost in the noise of natural climate variability. But if feedbacks are sufficiently positive (high climate sensitivity), then manmade global warming could be catastrophic.
Obviously, knowing the strength of feedbacks in the climate system is critical; this is the subject of most of my research.
Here you can read about my latest work on the subject, in which I show that feedbacks previously estimated from satellite observations of natural climate variability have potentially large errors. A confusion between forcing and feedback (loosely speaking, cause and effect) when observing cloud behavior has led to the illusion of a sensitive climate system, when in fact our best satellite observations (when carefully and properly interpreted) suggest an IN-sensitive climate system.
Finally, if the climate system is insensitive, this means that the extra carbon dioxide we pump into the atmosphere is not enough to cause the observed warming over the last 100 years — some natural mechanism must be involved.
Here you can read about my favorite candidate: the Pacific Decadal Oscillation.
D.Turtle wrote:Even what you posted was the person complaining that they stated it is likely (66-90%) while he thinks it is "as likely as not" (ca 50%).
Whether global warming's effects like the reduction of temperature difference between the poles and equator increases or decreases total weather intensity,* a perhaps 50% chance of increase versus a 50% chance of decrease (nothing in climate ever staying exactly the same over decades) is hardly an indisputable stirring reason to necessarily go all-out already on crippling the growth in carbon fixation within the world's food supply from CO2 enrichment.
* (That's not entirely unrelated to a thought experiment example of considering the relative magnitudes of turbulent convective heat transfer on one planet with uniform temperature, versus an imaginary non-rotating planet with a side hot and another cold, even though, of course, real weather is much more complicated).
D.Turtle wrote:But once again, this is only one of many different (mostly) negative effects of global warming. There are numerous others (observed and projected) that are even worse and a lot more certain.
We've already gone over most of the main ones, like the slight millimeters a year sea level rise, to the debatable degree it is accelerated by the temporary next 50-100 years of emissions before the era of cheap fossil fuel usage ends. (The IPCC
actually assumes that various emission scenarios go up forever in its modeling).
There are biased miscellaneous arguments like being terrified of more mosquitoes or higher air conditioning costs in some regions, when, in contrast, overall most of human civilization prefers warmer climates (like California) to colder climates (like Siberia). Back before the matter got politicized, historians invariably referred to times of warmer climate in positive terms. Such ranged from the Holocene Climate Optimum, to when the Romans were able to grow wine vineyards well in Britain, to the Medieval Warm Period when Greenland was relatively habitable for early Viking colonization, in contrast to the net harm of the Little Ice Age.
To give one example over a still longer timeframe, when the biomass of vegetation in northern Europe-Asia was reconstructed in a study, it was found to have grown to be 20% higher than now during the warm Holocene Climate Optimum 6000 years ago (a degree higher temperatures than modern-day), while it was 55% higher than now during the Eem Interglacial Optimum of 125000 years ago (when temperatures were 2 degrees higher).
Vegetation, phytomass and carbon storage in Northern Eurasia during the last glacial–interglacial cycle and the Holocene
Potentials for crop yields are related to how other biomass can do.
Anyway, most importantly, you have no quantitative metric or comparison supporting your assumption that these global warming effects even all combined (theoretical slight change in mortality from hurricanes, plus the number of millimeters of gradual sea level rise, etc) outweigh the huge observed increase in food production from CO2 enrichment. Almost nothing is more important than a sufficient food supply for human well-being. The fact is, the CO2 emissions of evil capitalist exploiters driving SUVs are substantially helping propel the continued increase in world agricultural productivity that keeps the expanding third-world population from starving.
To sum up much with a graph:
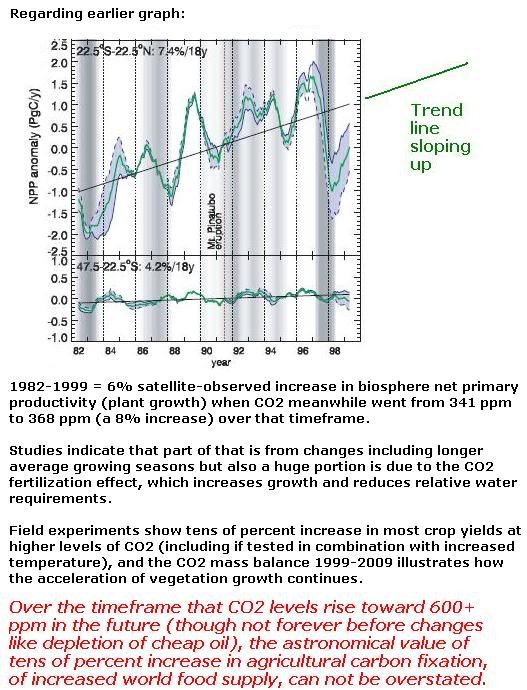 http://www.ncbi.nlm.nih.gov/pubmed/12791990
Climate-Driven Increases in Global Terrestrial Net Primary Production from 1982 to 1999
All this flies in the face of a lot of popular perceptions. In contrast, among the portion of the U.S. population who want to take action against global warming, 56% of them say it is at least somewhat likely that global warming will destroy human civilization within the next century (though 56% of that portion amounts to a lesser 23% of the total
population). That's the real level of knowledge or rather lack of it for the bulk of the AGW alarmist movement, no better than the worms and earthquake lies I was shooting down at the top of this thread.
D.Turtle wrote:And note that NEGATIVE sign at the Aerosols....
They're extremely inefficient and limited at negative radiative forcing compared to a smaller dispersion of different substances at higher altitudes, of uniformly optimal particle size and different composition, which is what happens when things are done by accident instead of intelligent, planned geoengineering.
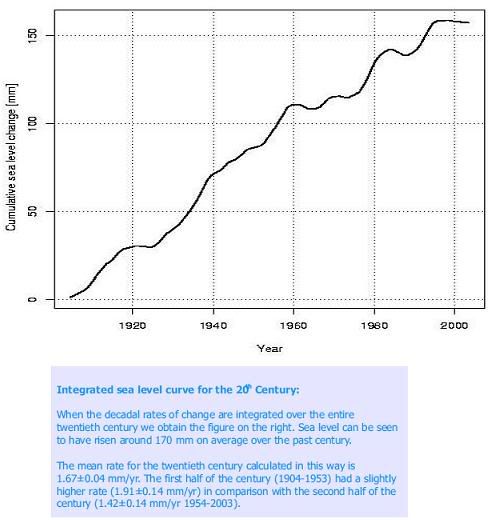
D.Turtle wrote:And no idea what that image you posted is supposed to prove (why the fuck would you look at the integrated sea level curve instead of the sea level itself?)
Dictionary link for you:
http://dictionary.reference.com/browse/integrated
The
integrated sea level curve is simply that obtained by combining readings from multiple tidal stations. Since that helps average out local errors, it increases accuracy.
D.Turtle wrote:Here is the appropriate image of sea level rise from the IPCC:
Large Image
You don't realize that such also depicts approximately a linear trend of near-constant rise rate for now versus 50 or even 100 years ago, showing a lack of major acceleration, not that much different from the other graph?
D.Turtle wrote:For the future, the projections are between 0.18 and 0.59 meters in sea level rise by about 2100.
So far it is on track for around the lower end of that range, as usual if one looks at past IPCC reports even on other topics like the 1988 temperature projections versus
observations.
Guess how an around 0.2 meter rise over the 21st century would compare to the 20th century? There was a 0.17 meter sea level rise in the 20th century as pointed out in the earlier graph.
D.Turtle wrote:So again, no one is saying that you have to move a 100 miles inland in order to have a beachfront property in 50 years. However, even that modest rise is enough to cause large damage to coastal regions and islands in secondary effect.
Outside of publicity in the past couple of decades as the matter got politicized, next to nobody even noticed much effect of the 0.17 meter rise in the 20th century, nor would they an around 0.2 meter rise in the 21st century. A lot of people lived through most of the 20th century not even aware of it. Sea levels have been rising since the last ice age thousands of years ago, and, as the graphs show, any recent acceleration in the rate of rise is rather limited, mostly rather a near-linear trend.
D.Turtle wrote:As for the tangent on geo-engineering: I'm quite sure that there are minor, tiny, unimportant, negligible uncertainties involved when throwing millions of tons of stuff directly into the stratosphere.
Dr. Teller's calculations correspond to merely around 0.05 tons per square mile on average, proportionally like cooling a city-size area with a few kilograms. Ten million tons of submicron stratospheric dispersed particulates is a lot more efficient than ineffectually attempting but failing to reduce CO2 emissions by an expensive hundreds of billions of tons. (The Kyoto treaty accelerated reallocation of CO2-emitting industry to exempt countries like China, with what politicians promised at the time having little to do with overall results looked at years later, and even this new Copenhagen treaty is going to be similar).
The basic principle is actually rather straightforward. As a thought experiment, begin with an oversimplified analogy and then work towards reality. If earth was simply a perfect airless sphere of rock, it is easy to calculate that covering 1% of its 5.1E14 m2 area with, for instance, aluminum, would have mass requirements varying depending on average thickness, an excessive 5.1E11 cubic meters if 1mm thickness but a mere 2.6E8 m3 if half-micron thickness. To instead further approach reality, substitute Dr. Teller's more efficient scattering particulates averaging around 0.0007 cubic microns each, and it turns out, as he calculated, only a lesser mere 1E7 tons becomes needed, 2E6 tons a year with 5 year average stratospheric residence time.
A couple million tons sent up a year vastly beats the astronomically greater expense of so many billions of tons of cutbacks in annual CO2 emissions throughout all types of industry, and that's hardly much of an uncertainty. Whether the Lawrence Livermore National Lab publication's estimates like under 1% the cost are precise, they're in the ballpark. Monitoring effects is easy enough with such ramped up over time starting from a trivial initial level. We already know stratospheric dust can scatter and reflect sunlight to cause cooling, as seen by historical temperature drops immediately after volcanic eruptions powerful enough to reach the stratosphere. The difference here is not wastefully blowing out billions of tons of debris and gases only to have a tiny fraction reach stratospheric altitude and be the right particle size.
Actually, estimated the light-scattering effect of stratospheric dust is hardly more complicated than the whole complicated system of CO2 versus water vapor, cloud, biosphere, etc, etc, etc, feedbacks in global warming models. Yet you don't say sarcastically that "I'm quite sure that there are minor, tiny, unimportant, negligible uncertainties" in those models, even though those future-predicting models are the basis for trillions of dollars of expenditures if the Copenhagen treaty is effectual at reducing CO2. (Actually I expect it to be ineffectual and largely ignored by even the signatory nations in practice afterward anyway, like usual, but I'm considering the hypothetical).
Now the real argument against such geoengineering, and the principle reason, aside from ideological blinders, that it isn't done today is that there is no universal human agreement that such temperature reduction would be an overall positive effect, because, frankly, the observed effects of global warming have been rather limited ... except for the enormous increase under recent CO2 enrichment in the average net primary productivity of plants worldwide.
Erik von Nein wrote:Polar Bears International has this to say on the matter:
<snip>
They're a group that collects any scientific data on polar bear populations.
They're an environmentalist advocacy group, a little like Greenpeace. A trend varying between different several-year periods is hardly much of a meaningful proof of impending extinction (considering the overall picture of 20000-25000 bears now unlike the 5000-1000 at the historical low point decades ago, since, while that is affected by hunting levels, the big picture is whether a large population of bears exists or not):
http://www.guardian.co.uk/commentisfree ... rfacedlies
You'd never know it from all those sorry photos of sad polar bears, but global polar bear numbers have actually increased over the past 40 years. In 2001, the polar bear specialist group of the World Conservation Union found that of 20 distinct polar bear populations, one or possibly two were declining, while more than half were stable and two subpopulations were actually increasing. In its more recent study of 2006, the group found a less rosy picture, but not much less rosy. It discovered that of 19 polar bear populations, five were declining, five were stable and two were increasing; there wasn't enough data to judge the fortunes of the remaining seven populations. The global polar bear population has increased from around 5,000 in the 1960s to 25,000 today.
According to Mitchell Taylor, a Canadian polar bear biologist, these beasts are not nearing extinction: "Climate change is having an effect on the west Hudson population of polar bears, but really, there is no need to panic. Of the 13 populations of polar bears in Canada, 11 are stable or increasing in number. They are not going extinct."
One of the "nine scientific errors" found in Al Gore's An Inconvenient Truth, following a case in the high court last year, concerned his hysterical claims about polar bears. Gore said that a scientific study had found that polar bears were drowning because they had to "swim long distances to find ice". Yet the only scientific study that Gore's team could provide was one which showed that "four polar bears have recently been found drowned because of a storm."
Lomborg has pointed out that, while the global polar bear population has increased since the 1960s, there has been some decline in subpopulations since the 1980s - but this is most likely related to hunting. Every year 49 bears are shot by hunters in the west Hudson area alone.



 Commander of the MFS Darwinian Selection Method (sexual)


