No topsoil left in Britain in 60 years

N&P: Discuss governments, nations, politics and recent related news here.

Moderators: Alyrium Denryle, Edi, K. A. Pital

User avatar
Admiral Valdemar
Outside Context Problem
Posts: 31572
Joined: 2002-07-04 07:17pm
Location: UK

Re: No topsoil left in Britain in 60 years

Post by Admiral Valdemar »

Tritonic wrote: Testing aircraft on synthetic fuels which can be domestically produced from biomass waste (or natural gas, or coal) is a sign of progress, and the military is particularly concerned because they need to consider worst-case scenarios up to major wars disrupting oil imports.
Sergio Gabrielli disagrees with you. Here some salient points.

- A new Saudi Arabia every three years is required to offset declines.

- Secondary and even extended recovery using NGL or CO2 injection will not offset such declines, which are now seen to be affecting even supergiants such as Khurais and Ghawar. There are now clear indicators the Saudis will experience hard declines.

- The rise in consumption within the KSA, and indeed, many resource exporting nations utilising new found wealth and population growth rates, means exports will take a hit, even without geological decline.

- There are reports that global decline rates, as a cumulative factor, are increasing. Your idea that Hubbert linearisation means multiple sine waves is patently false. It doesn't work that way, and makes me question your understanding of statistical analysis and field modelling.

- Prices have been growing at an increasingly rapid rate for the last decade to reflect the diminishing spare capacity worldwide. Given the precarious economic situation the globe finds itself in, we are finding it harder to remain with the growth paradigm during a time of increasingly expensive energy. Any nation where energy starts taking a larger share of GDP will experience hiccups that make BAU tricky, never mind growth (just look at the growth projections for the UK over the next few years released today).

Look closely at the dark blue part of the prior graph from the IEA:

They *do* expect major declines in old conventional oil fields, many millions of barrels/day seen by 2020. Where they differ from you, though, is that there is also the continuing expansion of the other sources depicted. The industry has been playing this game of depleting one oil field to move onto the next (plus expanding other sources) for a long time, and they are rather good at it. Many local sources peaked and declined decades ago. One actually could have made a similar graph a couple decades ago, since the fields which were producing back in 1990 have often declined greatly. We aren't going to directly currently see the megaprojects of, say, 2025 as much as those scheduled for 2011, since, like in any other field, construction would not begin that far in advance.

It won't utterly last forever. There is, of course, a reason it is so valuable that electric vehicles are greatly improving and headed towards being more mainstream. But it is dragged out over a long period of time. I'm not sure if you fully appreciate how your prediction appears to someone is used to every single decade someone saying this exact year or several years is the turning point of rapid disaster. I half-expect to be here in 2012 watching you make a prediction then about a sharp cliff in 2014 or something.
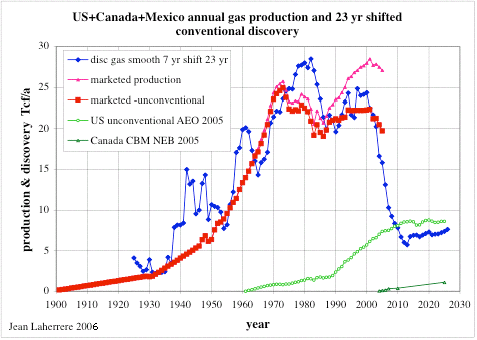
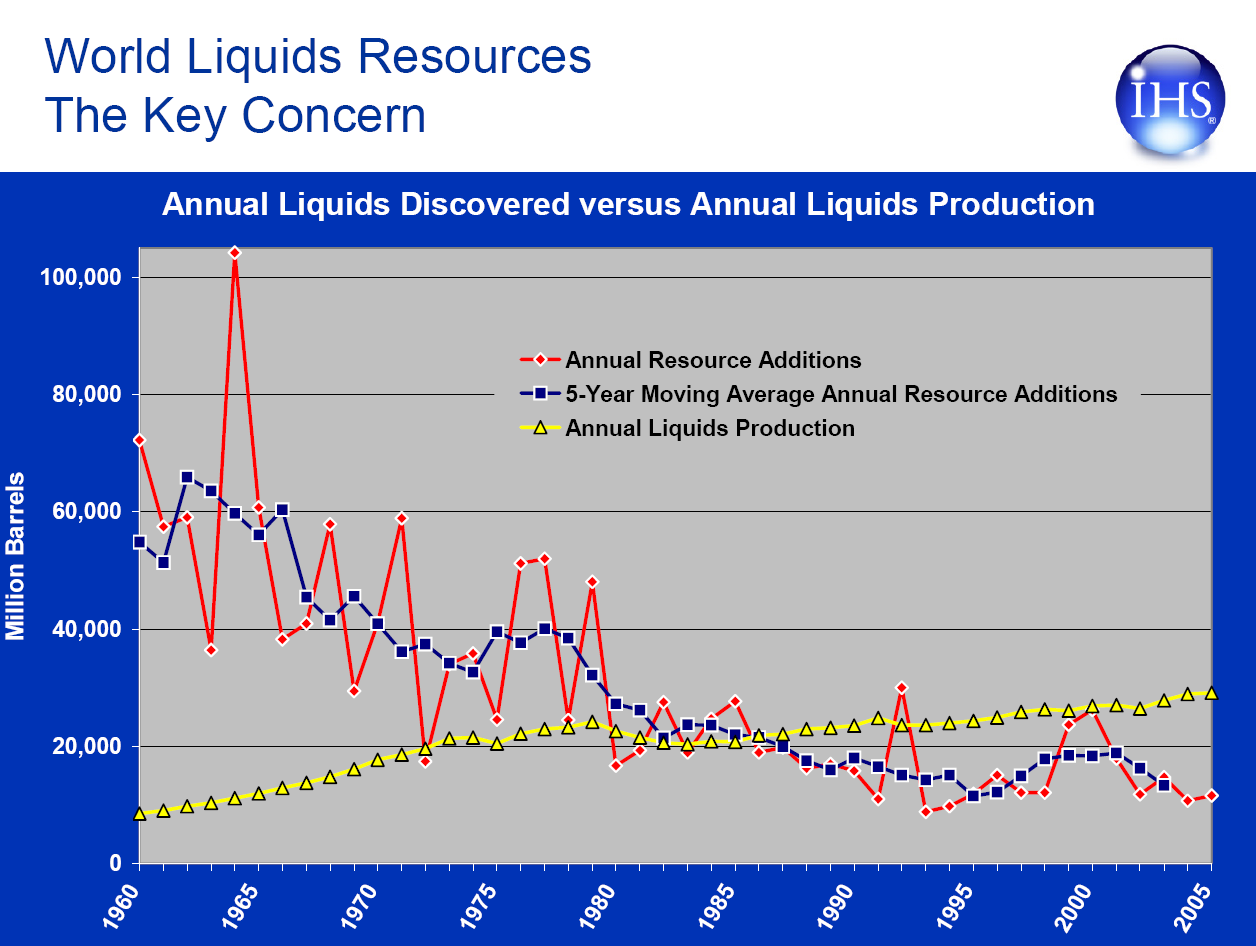
The CEOs of several very large public and national oil companies disagree with you. Even Rex Tillerson would question your view here, and he's not one to openly praise the peak oil camp.

Look at this chart:

Image

Do you see a problem? It should be quite apparent.

Thinking novel sources of oil, such as tar sands or shale, or even CTL, will make up this gap is simply a dream. The costs for tar sands, for instance, even as they are now at $85/bbl. has meant Shell has put all expansions of their project at the Athabasca tar sands on hold. That's one of the largest POCs on Earth, at some of the highest sustained prices for oil in history, saying that it just isn't enough. Keep in mind that a lot of these projects are also hideously dirty, and many owned by Chinese interests who won't be selling to Joe Sixpack if push comes to shove.

Remember, the plateaux we're on now has existed for some years. Even with record prices, we have not surpassed the output of 2005 for crude, or 2007/8 for all liquids. Also keep in mind that, despite Mike's comments to the contrary, my biology background is highly relevant to this situation. You can't pass Bio 101 without knowing the intimate details of entropy and thermodynamics, and ecology is all about this. The simple physics works against us, with bio-fuels offering their best EROEI in the tropics. Any species that devotes an ever increasing amount of its energy to acquiring more energy will eventually hit a ratio of 1:1 (for illustration, oil production in the US circa 1930 was around 100:1, meaning 100 barrels of oil for each one used. A healthy bottom line), and when this happens, no matter what technology or social movement is around, the species will die off to appropriate levels. The UK, for instance, could not, contrary to what you may think, run its airlines off rapeseed. Thermal depolymerisation, Fischer-Tropsch etc. are all very energy intensive processes, and neither can be scaled up and be competitively priced. There is no magic bullet. I would highly recommend reading David MacKay's book on renewable energy, even if it is more UK specific, it has some highly relevant points here relating to the physics and ecology.

Biofuels and CTL or tar sands require more energy to produce, so while nominal volumes may rise dramatically (the ethanol boom of a couple years ago in the US is an example, mainly via government subsidies), total net energy will not be so dramatic. It is cheap, easy oil disappearing that is the point of contention. Your pointing to alternative, heavy, sour and in some cases, totally unlike oil at all, examples to fight off the decline is indicative of how dire the situation is. This is the precise reason why prices are rising so fast and causing the receding horizons problem to occur. If the cost to produce the oil is too high, then the economy stalls (as we can see the credit crisis produced, which energy inflation facilitated). If the prices are too low, then this potential untapped oil stays just that: untapped. You can't sell oil at a loss, and no company will try, which led to a dramatic drop in rig count as the credit crunch hit, to the point that in the US for instance, natural gas prices dropped through to historical lows and caused problems with supply as no one wants to risk their neck in investing in a loss (this same logic applies to refinery capacity: if you can tell me why Big Oil isn't investing in more refinery capacity when you seem so confident in there being a continuation of BAU, and don't use the peak oil argument, then I'll buy you a beer).
Crude did indeed already peak long ago in terms of the most conventional crude. In many ways, that's a good thing, though, as it has spurred the development of other methods of getting liquid fuel, which is going to help us greatly as the most conventional supplies in old oilfields continue their decline.
No, they won't.

The global picture has been so much different meanwhile, though, because it is a superposition of many curves which are not all in sync, for different oil fields and for other sources. As a loose analogy, this is a bit like a mathematical situation, where you have a bunch of sine waves out of sync, and then you superimpose them to get a function which is relatively more flat than any single curve.
Again, wrong. This is most certainly NOT how the relevant agencies and commentators measure the health of global oil output. You have not addressed the fact that these new projects coming onstream are only keeping us on a plateaux. They have not, and will not, give us more production.

This really comes down to disputes over the specific numbers. Again, though, when you make such short-term predictions, the passage of time rapidly renders my arguments here unneeded and superfluous. I think the relative decline of oil prices after a largely speculation-driven jump a couple years ago did far more to tone down some of the 2007-2008 predictions on the internet than any argument meanwhile would have done so.
You think that speculation happens in a vacuum? Of course it was speculation! Please, read up on the marginal barrel and its relevance to this situation. Screaming "Speculators!" when prices rise is missing the point entirely.

And I have already shown you that the numbers are not disputed, not in the least. Appealing to the idea that the US military, for instance, is only thinking of a worst case scenario is laughable. Read the actual report and tell me that. This isn't Air Force 2025 fantasy masturbation, this is a 2010 assessment of America's energy security.

EDIT: Well fuck, I was editing the last post and it wouldn't save, so it resent another. Delete the one above, it's not corrected.
User avatar
J
Kaye Elle Emenopey
Posts: 5836
Joined: 2002-12-14 02:23pm

Re: No topsoil left in Britain in 60 years

Post by J »

Tritonic wrote:Image
3 problems with this chart.

1) Non conventional oil refers to the oil sands in Venezuela and Canada, it's claimed that oil sands productions will increase by several multiples over the next couple decades, this is not happening. To convert the oil sands into crude oil which can be pumped through pipelines & processed at refineries requires the oil be cat cracked and upgraded, this along with the extraction procedure requires tons of natural gas. Canada doesn't have the natural gas resources required to extract any more than a small fraction of its theoretical oil sands reserves, the natural gas and water constraints place a hard limit on both the daily production and the ultimate recoverable reserves. 10 million barrels a day will not happen unless dozens of nuclear plants are built to desalinate water, generate steam, and crack water to obtain the hydrogen required to upgrade the oil. Chances of that happening in the next 20 years as claimed? Zero.

2) The projections for production from crude oil yet to be found. One problem with that.
Image
So we're magically going to reverse this trend and find a whole ton of oil in the next few years. Keep in mind that it usually takes around 10 years from discovery to production. I haven't heard of any large discoveries recently, have you? And by large I mean something around the size of Prudhoe Bay, not a dinky little 1 billion barrel field.

3) Projections for fields yet to be developed. Ok, simple enough, where are these already discovered yet undeveloped fields that will give us nearly 20 million barrels per day in about 5 years? Keep in mind that this is a bit over two Saudi Arabias worth of production.
This post is a 100% natural organic product.
The slight variations in spelling and grammar enhance its individual character and beauty and in no way are to be considered flaws or defects


I'm not sure why people choose 'To Love is to Bury' as their wedding song...It's about a murder-suicide
- Margo Timmins


When it becomes serious, you have to lie
- Jean-Claude Juncker
User avatar
Admiral Valdemar
Outside Context Problem
Posts: 31572
Joined: 2002-07-04 07:17pm
Location: UK

Re: No topsoil left in Britain in 60 years

Post by Admiral Valdemar »

Tritonic
Youngling
Posts: 60
Joined: 2010-04-28 08:23pm

Re: No topsoil left in Britain in 60 years

Post by Tritonic »

Admiral Valdemar wrote:Sergio Gabrielli disagrees with you. Here some salient points.
Your document link is all in Portuguese, so I can't really comment on it (and I'm not sure whether you can read the language either, for that matter). But its main graph looks much like the bottom category of the IEA's graph I posted on the prior page minus not showing all else from natural gas liquids on.
Prices have been growing at an increasingly rapid rate for the last decade to reflect the diminishing spare capacity worldwide.
There's some truth there, though I wouldn't describe it in exactly the same manner. Oil prices over the past 5 years:

Image

As previously said, the 3% rise over the past 5 years in total liquids production (statistics) hasn't kept up with what demand would be if not for the price rise.

However, if any large percentage of industry experts thought your 2012 cliff scenario (and the "global decline rate in net energy of 4% at minimum") was valid, we'd know.* Everyone who could would be rushing to buy up oil now so they could resell at hundreds of dollars a barrel in two or three years under your scenario, or bidding accordingly on futures contracts. The fact that such isn't happening speaks volumes.

* (Of course, you haven't repeated that specifically recently, so there's always a slight chance that you changed your mind since your original post, but, if you did, the specifics could affect whether we have much of a real argument or not).
Given the precarious economic situation the globe finds itself in, we are finding it harder to remain with the growth paradigm during a time of increasingly expensive energy.
Increasingly expensive crude oil. Don't overgeneralize.

Nuclear, coal, et cetera energy is a different topic.

Ammonia is $305-$365 per ton now (a figure which is $0.97 to $1.16 per gallon, not bad even considering it is 74% the volumetric energy density of ethanol).

The mention of ammonia (NH3 made with hydrogen from water, nitrogen from air, and absolutely any energy source) is no accident: http://www.ammoniafuelnetwork.org/why.ht
Also keep in mind that, despite Mike's comments to the contrary, my biology background is highly relevant to this situation. You can't pass Bio 101 without knowing the intimate details of entropy and thermodynamics, and ecology is all about this. The simple physics works against us, with bio-fuels offering their best EROEI in the tropics. Any species that devotes an ever increasing amount of its energy to acquiring more energy will eventually hit a ratio of 1:1 (for illustration, oil production in the US circa 1930 was around 100:1, meaning 100 barrels of oil for each one used. A healthy bottom line), and when this happens, no matter what technology or social movement is around, the species will die off to appropriate levels.
Technology determines many factors including your energy return on energy investment, such as if you have the capability to produce petajoules (X * 17.8 million tons of TNT equivalent) energy from fissioning X fraction of a metric ton of uranium-233 being made from thorium-232 in a reactor, produced from abundant monazite sands with 6% to 12% thorium oxide, for a mining and refining energy investment in the mere gigajoule range per ton. Likewise, nothing in physics states that human energy production (1.7E13W thermal) must decline in the long-term or remain 0.45 trillionths of the sun's 3.8E26 watt output.

Economics is where you'll want to argue, as you seriously don't want to attempt to act like this is a matter of laws of nature, nor to get into "no matter what technology" level scenarios.
Thermal depolymerisation, Fischer-Tropsch etc. are all very energy intensive processes, and neither can be scaled up and be competitively priced.
What do you want to claim is the price of Fischer-Tropsch production of gasoline, diesel fuel, or jet fuel, from biomass waste, natural gas, or coal? You can't say unlimited cost. You may not want to stake your claims on a specific number. But this is about specific numbers or at least a general range, since, if you have no idea whatsoever, you can't come to conclusions.

Now I could give figures, such as from Sasol, a company in South Africa which produces most of that country's diesel fuel from natural gas and coal. But you're one arguing they can't be competitively priced, which is a particularly grand claim in context when you apparently expect oil prices to climb to many times what they are now under your 2012 cliff prediction.
Look at this chart:

Image

Do you see a problem? It should be quite apparent.
I can't really judge the accuracy of that Tony Eriksen guy without a basis for comparison. For instance, if he was around in 1995 and made a chart of the future then, would today's 2010 projects all appear on his chart?

He sees fewer new project additions in the future, dropping to basically zero in his chart in 2019, but would we really expect the general public to receive announcements of projects 10 years away when they may not have started construction or be in current press releases? Also, he describes some projects as "yet to be sanctioned," but, if that means waiting for judgment of profitability or even government environmental approval, a situation of rising oil prices would tend to make even the most currently borderline projects go full steam ahead.

Unless you've changed your argument, you're aiming to use this to support your 4%/year global energy decline starting in 2 years. But his so-called "oil crunch" is his predicted 2.5 mbd additions in 2012 being less than 3.2 mbd in 2011 (or 2.8 mbd in 2004, etc). Out of around 87 millions barrels a day world production, that's literally a fraction of 1% difference. I'm not here to debate plus or minus 1%.
Notice what your link says in part?
Your link wrote:The expansion will now require an oil price of $70 to $75 to turn a profit, making it “some of the most expensive production that we have,” Mr. Odum said.

Shell internally forecasts future oil prices between $50 and $90 – a range that potentially excludes the oil sands, and makes other global projects more attractive unless the company can find a way to beat back costs.

Shell will only commit “to watch the market and see when is the next time to commit to the next major expansion of the oil sands,” Mr. Odum said.
I added the bold and underlining.

You make a very devoted effort to try to argue that the likes of your prediction is shared by experts, but such as the above from the experts of a multi-billion dollar company is outright contradictory, as you'd never have merely $50-$90/barrel future oil prices in your scenario. If oil prices do rise, the economics will change as they imply.

Ah well. If you really believe your 2012 prediction is correct, then you'd have a huge opportunity, putting all the money you could spare into oil futures, to make a great profit from outguessing the collective wisdom of the market.
Tritonic
Youngling
Posts: 60
Joined: 2010-04-28 08:23pm

Re: No topsoil left in Britain in 60 years

Post by Tritonic »

J wrote:The projections for production from crude oil yet to be found. One problem with that.

<snip chart>
Your graph shows its peak in 1960-1965. If you share the view of Admiral Valdemar that started this argument (his 2012 oil cliff followed by 4%/year global energy decline prediction), you'd need to show in detail a huge difference between 2012, about fifty years after that peak, versus how we're already actually fifty years after that peak now in 2010.

If you just rather want to argue that the long-term future of crude oil is in decline, I don't even disagree there. Just huge changes happen more over a period of decades.

Technically we could get into your graph versus such as this different graph which doesn't entirely match up (perhaps due to differences in what is counted as an oil discovery, conventional or unconventional?).

But experts at the IEA are certainly aware of historical oil discovery trends. They don't actually show a lot of new discoveries expected in the "crude oil - fields yet to be discovered" part of their graph, rather far more showing such as natural gas liquids and the "crude oil - fields yet to be developed" (meaning oil fields already discovered but not yet in full development, like offshore areas among the U.S. coast, being opened up by President Obama actually repealing prior environmental restrictions, and a ton of other places).
Non conventional oil refers to the oil sands in Venezuela and Canada, it's claimed that oil sands productions will increase by several multiples over the next couple decades, this is not happening.
The IEA's definition of unconventional oil and what they look at is broader:

"Unconventional oil production is based on the IEA’s Oil Market Report (OMR) definitions and includes the following sources:
• Oil shales
• Oil sands-based synthetic crudes and derivative products
(heavy oil, Orimulsion®)
• Coal-based liquid supplies
• Biomass-based liquid supplies
• Gas to Liquid (GTL) - liquids arising from chemical processing
of gas"

Still, for Canadian oil sands alone, an official Canadian government site's projection:

Image

Yes, I know you're arguing differently, but can you see how it is you versus an official source? Now I'm not saying that official sources are always more accurate than amateurs, but they do still have a credibility advantage by default.

Prior history:

Image
10 million barrels a day will not happen unless dozens of nuclear plants are built to desalinate water, generate steam, and crack water to obtain the hydrogen required to upgrade the oil.
Really? Suppose we use an EROEI of 2:1 as an example. (That's rather pessimistic, since Syncrude is apparently managing 4:1, thus much better). Even at the high cost of 2:1 EROEI, we have only 3.06E9 J required per barrel produced. A 1 GW electrical output nuclear power plant (like what we use to power a city) produces 2.8E16 joules of electricity a year at a 90% capacity factor, or around triple that in total thermal energy. We'll pessimistically assume no thermochemical water cracking, just electrolysis for your hydrogen, pessimistically considering only the electrical output.

Still one such nuclear power plant ought to power 10 million barrels a year if that EROEI figure fully takes into account inefficiencies, as it should. After all, 2.8E16 J / (3.06E9 J / barrel) =~ 1E7 barrels. Even if it doesn't and if the situation is a bit more pessimistic, I'm still not seeing where your "dozens of nuclear power plants" comes from unless you mean a bunch of quite small ones.

Of course, 10 million barrels a day from Canadian oil sands alone as a target is just your own figure. We don't need so much from that one source alone anytime very soon. The projection graph above is expecting much less, and the IEA itself only predicts about 10 million barrels a day by 2020-2030 in its graph from all non-conventional oil sources worldwide combined, not just oil sands alone and not just Canadian oil sands alone.
User avatar
K. A. Pital
Glamorous Commie
Posts: 20813
Joined: 2003-02-26 11:39am
Location: Elysium

Re: No topsoil left in Britain in 60 years

Post by K. A. Pital »

Tritonic, the expansion of non-conventional hydrocarbon power sources is obviously happening. The problem is it's pace and energy efficiency. If (1) it's energy efficiency would be lower than conventional crude, or (2) the pace of replacement is slower than the pace of contraction of the crude oil supply (which seems to be the case in more than a few predictions), then the stress on the energy system would be much larger than IEA graphs imply.

Not that the graphs they show don't imply a colossal stress already due to a reduced energy efficiency - if the volume of extraction stays the same and reaches some sort of plateau with non-conventional hydrocarbons, it would still be a colossal economic stress due to a EROEI reduction from higher averages to lower ones, meaning energy will become more expensive.

You say it's not a problem if energy goes to extract oil from NC sources, but it is - that same energy is being used to extract oil instead of being used to power up the industry.

This means the energy hunger of the industrial world will intensify, even if non-conventional oils match the reduction in conventional crude production at a barrel-per-barrel rate, but at a lesser energy efficiency.
Lì ci sono chiese, macerie, moschee e questure, lì frontiere, prezzi inaccessibile e freddure
Lì paludi, minacce, cecchini coi fucili, documenti, file notturne e clandestini
Qui incontri, lotte, passi sincronizzati, colori, capannelli non autorizzati,
Uccelli migratori, reti, informazioni, piazze di Tutti i like pazze di passioni...

...La tranquillità è importante ma la libertà è tutto!
Assalti Frontali
Tritonic
Youngling
Posts: 60
Joined: 2010-04-28 08:23pm

Re: No topsoil left in Britain in 60 years

Post by Tritonic »

I wrote:Suppose we use an EROEI of 2:1 as an example. (That's rather pessimistic, since Syncrude is apparently managing 4:1, thus much better). Even at the high cost of 2:1 EROEI, we have only 3.06E9 J required per barrel produced. A 1 GW electrical output nuclear power plant (like what we use to power a city) produces 2.8E16 joules of electricity a year at a 90% capacity factor, or around triple that in total thermal energy. We'll pessimistically assume no thermochemical water cracking, just electrolysis for your hydrogen, pessimistically considering only the electrical output.

Still one such nuclear power plant ought to power 10 million barrels a year if that EROEI figure fully takes into account inefficiencies, as it should. After all, 2.8E16 J / (3.06E9 J / barrel) =~ 1E7 barrels.
Actually I need to make a major correction to the above. I typed too fast when sleepy, and something didn't seem right on second glance. The above is all technically true. But I was going to do it for 10 million barrels a day, not per year. Using Syncrude's EROEI number under the pessimistic electricity-only assumptions rather gives 199 nuclear power plants of 1 GW. They produce about triple that in thermal power, so consideration of thermal power instead of assuming all energy used was electric-only would drop the number greatly.

Still, obviously that's quite a bit different from my earlier example.

With that said, 10 million barrels per day would be for the whole world's non-conventional oil if it was all oil sands (not that actually all nonconventional oil is oil sands). In the Canadian oil sands projection by the Canadian government in my earlier graph, they show going from 1.9 million barrels a day to 3.3 million barrels a day between 2010 (now) and 2020. That's a goal of a 1.4 million barrel a day production increase. So that increase is nominally in raw energy terms requiring at a 4:1 EROEI the equivalent of the electrical output of 28 one-gigawatt-electric nuclear power plants, or the thermal output of 10 such nuclear power plants.

However, this is all operating under an excessively pessimistic case of assuming 100% of the energy comes from external sources, not realistic. Rather the actual production is using some of the oil sands themselves for energy to help extract oil sand, as well as using thermal energy and not just electrical (such as for steam injection). For instance:
These techniques include steam injection, solvent injection, and firefloods, in which oxygen is injected and part of the resource burned to provide heat.
http://ostseis.anl.gov/guide/tarsands/index.cfm
Tritonic
Youngling
Posts: 60
Joined: 2010-04-28 08:23pm

Re: No topsoil left in Britain in 60 years

Post by Tritonic »

Stas Bush wrote:Tritonic, the expansion of non-conventional hydrocarbon power sources is obviously happening. The problem is it's pace and energy efficiency. If (1) it's energy efficiency would be lower than conventional crude, or (2) the pace of replacement is slower than the pace of contraction of the crude oil supply (which seems to be the case in more than a few predictions), then the stress on the energy system would be much larger than IEA graphs imply.

Not that the graphs they show don't imply a colossal stress already due to a reduced energy efficiency - if the volume of extraction stays the same and reaches some sort of plateau with non-conventional hydrocarbons, it would still be a colossal economic stress due to a EROEI reduction from higher averages to lower ones, meaning energy will become more expensive.

You say it's not a problem if energy goes to extract oil from NC sources, but it is - that same energy is being used to extract oil instead of being used to power up the industry.

This means the energy hunger of the industrial world will intensify, even if non-conventional oils match the reduction in conventional crude production at a barrel-per-barrel rate, but at a lesser energy efficiency.
The energy hunger of the industrial world has been greatly increasing. For instance, twenty years ago in 1990, the world consumed and produced 1280 gigawatts of electricity (average generation). Now we produce 2197 terawatts average generation. (Figures are from here and here respectively).

The world literally added 917 gigawatts of power generation over the past 20 years, the equivalent of 917 one-gigawatt-each nuclear power plants (even though actually most were coal).

Anyway, I'm not disagreeing with the general idea that there will be extra stress. Just it has to be placed in context such as by the estimates of the experts at the official IEA, and the likes of Admiral Valdemar's original prediction I was arguing against (2012 oil cliff and 4%/year or 40%/decade world energy decline) are not justified.
Tritonic
Youngling
Posts: 60
Joined: 2010-04-28 08:23pm

Re: No topsoil left in Britain in 60 years

Post by Tritonic »

Also, it is key to consider the percentage of GDP which is spent on oil extraction or acquisition. In the example of America, we consume 20.8 million barrels a day, which at such as $86/barrel is $1.79 billion a day, which is $653 billion a year. (Since such is for the oil in crude form, it doesn't include all costs like refining it further, yet those costs are separate from the production or acquisition cost of the original oil anyway).

That's a lot, yet at the same time it is out of a $14.3 trillion economy, making its acquisition cost thus 4.6% of the total economy. That is in turn an illustration of how a X% rise in oil cost would mean a lot less than an X% decrease in the overall economy or average income per person.

Such of course fits with experience in prior history history. When oil prices doubled at their high point a couple years ago, it substantially hurt the economy but didn't destroy it.
User avatar
Iosef Cross
Village Idiot
Posts: 541
Joined: 2010-03-01 10:04pm

Re: No topsoil left in Britain in 60 years

Post by Iosef Cross »

Hi Tritonic, what do you do? Are you an agronomist?
User avatar
Iosef Cross
Village Idiot
Posts: 541
Joined: 2010-03-01 10:04pm

Re: No topsoil left in Britain in 60 years

Post by Iosef Cross »

Stas Bush wrote:if the volume of extraction stays the same and reaches some sort of plateau with non-conventional hydrocarbons, it would still be a colossal economic stress due to a EROEI reduction from higher averages to lower ones, meaning energy will become more expensive.
What was the evolution of energy prices in the last 40 years? Well, oil prices greatly increased, but they were lower in 2000 than in 1980.

Coal prices in the other hand, didn't increase in the last 80 years. In fact, most of China's energy come from coal because it is cheap. And we have current coal reserves to supply your annual rates consumption for the next 900 years, I think.
User avatar
Iosef Cross
Village Idiot
Posts: 541
Joined: 2010-03-01 10:04pm

Re: No topsoil left in Britain in 60 years

Post by Iosef Cross »

Stas Bush wrote:
Tritonic wrote:Lumping all non-renewable energy resources together isn't that directly relevant to anything like the timeframes Admiral Valdemar was going on about, given the magnitude of coal reserves, natural gas / methane hydrate reserves, etc.
The problem is that oil currently constitutes 37% of the world's energy consumption. Assuming a 0,5% per year replenishment rate (i.e. gas or coal can replenish 0,5% of lost oil consumption per year), that would still take no less than a few decades. If oil consumption falls at a faster rate, it will produce enormous stress on the whole energy supply system. Not that the stress isn't already evident, with demand for energy rising faster than supply of said energy. The oil dependency of the world is still enormous. A collapse of oil consumption in 10-20 years is a catastrophic event. If the consumption will fall in a longer timeframe (30 to 60 years), it would still produce an enormous stress, which might be too much to handle. A comfortable timespan for oil use reduction which would not produce stress or require urgent and extreme measures to expand other sources of energy' use is 60 to 120 years. In that case, oil energy reduction will proceed at a rate of less than 0,5% per year and thus be more or less comfortable for the world to shift.
Hi Bush. The oil problem is real, even thought isn't that big. For most uses, oil consumption can be greatly reduced:

In electric energy production, oil can be replaced with coal.

In transportation, oil can be replaced with coal for trains and ships, with transport most of the world's cargo.

Much of oil production is consumed by private cars. Specially in the US. This kind of luxury consumption can be cut easily by: Reducing average engine size, increasing engine efficiency and decreasing use.

Also, in the US much of oil consumed is used for things like heating, with global warming this need will be cut. While air conditioning demand for energy will increase, but the good news are that it is mostly powered by coal.

The rate of relative decrease of oil in energy importance will be governed by it's price. If oil prices stay in the 100 dollar range and continue to increase, their relative importance will fall fast. The first types of consumption to be cut will be the consumer types, like car's demand.
Tritonic
Youngling
Posts: 60
Joined: 2010-04-28 08:23pm

Re: No topsoil left in Britain in 60 years

Post by Tritonic »

Iosef Cross wrote:Much of oil production is consumed by private cars. Specially in the US. This kind of luxury consumption can be cut easily by: Reducing average engine size, increasing engine efficiency and decreasing use.
Indeed.

For instance, the automobile fuel efficiency standard in America is to be 35.5 mpg for new vehicles made in 2016 on, which would correspond to them using almost half as much gas per mile driven as the 20 mpg average of the average personal vehicle on the road today (now versus then).

Then of course there are the combination of factors that occur in high stress scenarios. If, for instance, a 30% change was necessary within so-and-so timeframe, one example would be countering 10% by higher mpg cars on average, countering another 10% by less non-critical extra recreation-related driving due to gas prices, and countering another 10% by alternative fuels or extra non-conventional liquids production. Of course, in that example those numbers are just made up, but it is notable how a multitude of individually small changes really add up.
If oil prices stay in the 100 dollar range and continue to increase, their relative importance will fall fast.
Although it is $86 a barrel right now, indeed that is true. In fact, a commonly suspected reason OPEC cartel countries such as those in the Middle East aim for $70 to $90 per barrel usually as a price target (increasing production intentionally to lower prices sometimes), rather than having cut production to let prices have risen to and stayed at $150+ a barrel for vastly greater profits, is that they're concerned about what would happen otherwise, knowing we do have some options to decrease our oil intensity and decrease our dependence on them if we get sufficiently motivated.
In electric energy production, oil can be replaced with coal.


Quite so. And in many countries we've already almost 100% replaced oil fuel when it comes to electrical generation. For instance, U.S. electrical generation was about 1/5th oil-fueled at its high point in the 1970s. Then after oil zoomed above $100 a barrel temporarily in 1979 (in today's dollars), we now have around 98% of electrical generation from other sources instead. In raw energy terms, today's $86 a barrel oil is $14.83 per million Btu, whereas today's coal is a vastly lesser $2.21 per million Btu energy content (oil versus coal in America).

Only oil's liquid fuel convenience in portable applications keeps it so heavily used today despite it thus costing 7 times as much as coal per unit energy. (Of course, ideally we'd have more nuclear instead of coal, but still...)
Hi Tritonic, what do you do? Are you an agronomist?
I'm flattered, thank you, but no. I'm just an anonymous guy on the internet, although with an engineering background (more math-based than biology majors, for instance) that helps give a problem-solving perspective and emphasizes the importance of running numbers, skeptical critical thinking, and watching against mere assumptions, plus a bit of a pro-technology bias. I intentionally keep real-life and online identities utterly separate for certain reasons. (I'll switch to PMs instead if appropriate). But I aim to provide verifiable reference links on anything controversial, to let arguments stand on their own merits, so nothing has to be taken on trust in me personally.

Although some of my arguments are appealing to the authority of top official government organizations, I wouldn't similarly appeal to myself or any other single individual's authority, since that'd be far too dependent on assuming individual honesty plus zero bias, a really bad idea on the internet (not that I've lied anywhere, despite a few rather embarrassing mistakes later corrected by myself, but still...)

Speaking of that, let me correct another mistake made typing while sleepy last night:
I wrote:For instance, twenty years ago in 1990, the world consumed and produced 1280 gigawatts of electricity (average generation). Now we produce 2197 terawatts average generation. (Figures are from here and here respectively).

The world literally added 917 gigawatts of power generation over the past 20 years, the equivalent of 917 one-gigawatt-each nuclear power plants (even though actually most were coal).
The point is accurate (an illustration of a 72% increase in power generation in 20 years), but there were 2 minor mistakes:

1) The "2197 terawatts" should be "2197 gigawatts" of course.

2) The 917 GW growth in overall average generation around the clock wasn't the equivalent of just 917 one-gigawatt power plants but rather more, considering capacity factors aren't 100%, such as more like the equivalent of 1020 such power plants with a 90% average capacity factor. Of course, in practice, it was a greater diversity of power plants, many of smaller sizes and some of still lower capacity factor but more numerous.

BTW, Iosef Cross, I see you're in Brazil. As a country where growth is major and change rapid, that probably helps your perspective, and I've heard your country is a leader in flex fuel vehicles and alternative fuels, ethanol especially but also much more common compressed natural gas fueled vehicles than most places. Maybe you could add more on that if the discussion continues.
User avatar
J
Kaye Elle Emenopey
Posts: 5836
Joined: 2002-12-14 02:23pm

Re: No topsoil left in Britain in 60 years

Post by J »

Tritonic wrote:Your graph shows its peak in 1960-1965. If you share the view of Admiral Valdemar that started this argument (his 2012 oil cliff followed by 4%/year global energy decline prediction), you'd need to show in detail a huge difference between 2012, about fifty years after that peak, versus how we're already actually fifty years after that peak now in 2010.
The production curve is the discovery curve offset by around 50 years.
Image
The peak discovery years were in the early 60's, peak production was 2005 or so (it would've been a few years earlier were it not for the Arab oil embargo and the Gulf War). Prof. Kenneth Deffeyes goes into more detail on this in his book Beyond Oil: The View from Hubbert's Peak.
But experts at the IEA are certainly aware of historical oil discovery trends. They don't actually show a lot of new discoveries expected in the "crude oil - fields yet to be discovered" part of their graph, rather far more showing such as natural gas liquids and the "crude oil - fields yet to be developed" (meaning oil fields already discovered but not yet in full development, like offshore areas among the U.S. coast, being opened up by President Obama actually repealing prior environmental restrictions, and a ton of other places).
Excerpt from EIA report on offshore drilling in the US:
The projections in the OCS access case indicate that access to the Pacific, Atlantic, and eastern Gulf regions would not have a significant impact on domestic crude oil and natural gas production or prices before 2030. Leasing would begin no sooner than 2012, and production would not be expected to start before 2017. Total domestic production of crude oil from 2012 through 2030 in the OCS access case is projected to be 1.6 percent higher than in the reference case, and 3 percent higher in 2030 alone, at 5.6 million barrels per day. For the lower 48 OCS, annual crude oil production in 2030 is projected to be 7 percent higher—2.4 million barrels per day in the OCS access case compared with 2.2 million barrels per day in the reference case (Figure 20).
Opening up the entire US coastal areas for oil production barely makes a difference. The same is true of most other areas, there's a few potential large projects in the 1 million barrel/day range in the Caspian Sea and Middle East but that's about it. I can't find anything that adds up to the IEA claims in the chart.
Tritonic wrote:The IEA's definition of unconventional oil and what they look at is broader:

"Unconventional oil production is based on the IEA’s Oil Market Report (OMR) definitions and includes the following sources:
• Oil shales
• Oil sands-based synthetic crudes and derivative products
(heavy oil, Orimulsion®)
• Coal-based liquid supplies
• Biomass-based liquid supplies
• Gas to Liquid (GTL) - liquids arising from chemical processing
of gas"
In order, respectively, not happening, Canada & Venezuela only, not happening, not happening, ditto. The only significant source of unconventional oils for the foreseeable future is oil sands.
Still, for Canadian oil sands alone, an official Canadian government site's projection:

Image

Yes, I know you're arguing differently, but can you see how it is you versus an official source? Now I'm not saying that official sources are always more accurate than amateurs, but they do still have a credibility advantage by default.
Excerpt from a recent Globe & Mail article:
The energy industry’s ambitious growth projections back in 2008 were derailed by a myriad of problems. The economic crisis wreaked havoc on the sector. Projects faltered and timelines were extended. Technical issues, for instance, have so far kept both Husky Energy’s Tucker Lake and Nexen Inc.’s Long Lake oil sands projects far from their original production goals.

Starting in late 2008, fully 1.2 million barrels a day of future projects were deferred or cancelled in the oil sands, as soaring costs and tumbling crude prices scared away investors. The economic recovery has brought some of that work back to life, but even industry projections now show a sobering new reality. According to the Canadian Association of Petroleum Producers, the volume of oil previously expected by 2011, the first full year of operation for Alberta Clipper, will now not likely flow until 2018 or later.
The government forecasts are hopelessly optimistic. When you look at the actual projects which are planned along with their projected completion dates, the numbers end up being a lot worse.
This post is a 100% natural organic product.
The slight variations in spelling and grammar enhance its individual character and beauty and in no way are to be considered flaws or defects


I'm not sure why people choose 'To Love is to Bury' as their wedding song...It's about a murder-suicide
- Margo Timmins


When it becomes serious, you have to lie
- Jean-Claude Juncker
User avatar
J
Kaye Elle Emenopey
Posts: 5836
Joined: 2002-12-14 02:23pm

Re: No topsoil left in Britain in 60 years

Post by J »

Tritonic wrote:With that said, 10 million barrels per day would be for the whole world's non-conventional oil if it was all oil sands (not that actually all nonconventional oil is oil sands). In the Canadian oil sands projection by the Canadian government in my earlier graph, they show going from 1.9 million barrels a day to 3.3 million barrels a day between 2010 (now) and 2020. That's a goal of a 1.4 million barrel a day production increase. So that increase is nominally in raw energy terms requiring at a 4:1 EROEI the equivalent of the electrical output of 28 one-gigawatt-electric nuclear power plants, or the thermal output of 10 such nuclear power plants.
Like I said, dozens. I've previously worked out the math since I research & write energy & trade policy reports for my government. In the future we won't have the natural gas needed to make steam and upgrade the oil, at least not if we don't want people to freeze to death in our cold Canadian winters. This is why there's a lot of research & proposals to adapt CANDU nuclear plants for oil sands production, both to generate the raw steam for oil extraction and producing electricity to crack water for the hydrogen used in upgrading the oil. We'd also need them to run desalination plants so we don't use up all the fresh water in the area.
However, this is all operating under an excessively pessimistic case of assuming 100% of the energy comes from external sources, not realistic. Rather the actual production is using some of the oil sands themselves for energy to help extract oil sand, as well as using thermal energy and not just electrical (such as for steam injection).
Steam injection requires natural gas, electricity, or some other external source of energy to generate the steam. Air injection methods such as THAI which use the oil sands to generate the energy needed for extracting oil are still in the early experimental phases and at least a good 5-10 years away from volume production, assuming that they prove out and work as advertised. Petrobank carried out a small scale experiment using their THAI technology in 2007, since then there've been no larger scale developments. Their CAPRI project was started last year and though initial results are promising, once again, there's been no larger scale follow through yet. There's still a lot of work to be done since they still need to determine if the method will work on all or at least a large percentage of oil sands formations or if it only works for a small subset of them.
This post is a 100% natural organic product.
The slight variations in spelling and grammar enhance its individual character and beauty and in no way are to be considered flaws or defects


I'm not sure why people choose 'To Love is to Bury' as their wedding song...It's about a murder-suicide
- Margo Timmins


When it becomes serious, you have to lie
- Jean-Claude Juncker
Tritonic
Youngling
Posts: 60
Joined: 2010-04-28 08:23pm

Re: No topsoil left in Britain in 60 years

Post by Tritonic »

J wrote:<graph snipped>
Several points:

1) Essentially, you're aiming to argue against my graph of the IEA's projections with the charted projections of Mr. Jean Laherrere.

So, how does the past accuracy of the International Energy Agency compare to individuals (even the occasional geologist or engineer) making much different predictions? To get at least some idea on that significant question, we can look at past history. An example:

The following other guy kept revising his, as can be seen for 1991 versus 1997 predictions, and that's a trend I've often seen over the years, where a new peak projection keeps getting put out by some individuals (once the date for the past peak projection gets passed without things going as they predicted):

Image

Let me create an edited version of the above, though, so we can see how the official IEA did in hindsight, at least if we refer to total liquids production now. I added markings showing what the actual 2010 production is turning out to be, 86.5 million barrels/day (first quarter 2010 data ). The IEA was even surprisingly accurate for a 1996 prediction of now 2010:

Image

So someone back in 1991 or 1997 who trusted the official IEA more than that one guy would have done better.

This could be considered unfair since I'm talking about a different person's projections, when your graph is from a Mr. Laherrere, not my Dr. Campbell example. But I just want to illustrate how important it is not to jump to conclusions when some individuals contradict the IEA. Even though certainly the IEA's future projection capability hasn't been perfect, never underestimate how much even far worse potentially can be the inaccuracy of just some single individuals, even though Dr. Campbell was indeed a geologist and your Jean Laherrere is indeed an engineer (although, in both cases, for whatever reasons, differing from the ordinary official consensus and showing a remarkable degree of neglecting liquids other than conventional crude). Exciting predictions can spread on the internet more than really boring predictions, whether or not the former really represent the view of most experts in the industry.

2) Regarding:
J wrote:peak production was 2005 or so
That you state peak production was 5 years ago reinforces something previously suspected: Again there is too much focus on conventional crude alone and not all liquids. After all, as pointed out before, IEA data shows that current total production is 3% higher now at 86.5 million barrels/day than the 83.8 million barrels/day it was back 5 years ago in 2005.

3) Let's take a closer look at part of your graph to compare to the IEA.

Image

Compare to the IEA:

Image

Looking at closely, I can see what that individual is claiming:

73 million barrels a day approximately in 2010 (right now).
74 million barrels a day peak in 2012.
70 million barrels a day (approximately exactly) in 2020.
55 million barrels a day in 2030. He seems to have intentionally set these numbers to be round at round-number year intervals.

So now we can compare this to the IEA's data and predictions:

2010 today = 86.5 mbd in reality, though crude oil alone is closer to 70 mbd
2020 =~ 95 mbd total liquids. Old crude oil fields = 39 mbd. Fields undeveloped back in 2010 but already discovered raise the preceding part towards 64+ mbd.
2030 =~ 105 mbd total liquids. Old crude oil fields = 28 mbd. Fields undeveloped back in 2010 but already discovered raise the preceding part towards 50+ mbd.

So his estimates are basically like the IEA's, except for the following differences:

a) Simply not showing or considering liquids from other sources such as natural gas liquids (thus giving 73 million barrels a day for now 2010 when the real total is 86.5 million barrels a day).
b) His 2020 and 2030 predictions nearly correspond to the bottom two components of IEA predictions, if neglecting to consider non-conventional oil, natural gas liquids, and a small but still somewhat substantial amount of fields yet to be discovered.

Natural gas liquids are of full relevance here. In fact, raw natural gas itself in general is of partial relevance, even though of course the IEA doesn't count it in the liquids figures.

Although currently uncommon in America, Canada, or Europe, there are 9.7 million natural gas vehicles in Asia and South America today, and their numbers are expanding. Most of them use simply compressed natural gas in pressurized tanks.

Image

4) If your views contradictory to the International Energy Agency were shared within the industry expert community (and, most of all, if Admiral Valdemar's very extreme 2012 predictions were), we would see a huge rise in futures prices already, not happening to remotely the degree your predictions would require. Many would be trying to stock up on oil now to resell at hundreds of dollars a barrel in several years, if your predictions were accepted.
I can't find anything that adds up to the IEA claims in the chart.
The only significant source of unconventional oils for the foreseeable future is oil sands.
Regarding both of these remarks, the IEA lists a whole bunch of data on its http://omrpublic.iea.org/ which even I have looked through somewhat, with so many details on sources from Africa to offshore, as well as everything down to the coal to liquids production going on in China today. I'll probably add more on that topic in the next round of this debate.
The government forecasts are hopelessly optimistic. When you look at the actual projects which are planned along with their projected completion dates, the numbers end up being a lot worse.
That part isn't particularly surprising. When various factors including the market were driving the oil price towards $150/barrel a couple years, many people utterly didn't expect the rapid subsequent price drop to under $50 a barrel temporarily (more recently hovering around $80/barrel, $86 specifically). Even some of the oil companies weren't expecting quite that much of a price drop, leading to a number of non-conventional oil projects being put on hold for the time being once it became clear the conventional crude competition was undercutting them again. Plus, even if there weren't those factors, most projects in every field usually fall behind schedule, even if we're talking about something totally different such as government contracts for producing military aircraft (usually ending up overbudget and behind schedule), the general human Planning Fallacy.

With all that said, although I've been rather hard on your points, it would be invalid not to recognize that there is partial truth within them.

Certainly crude oil in oil fields currently under production is declining, and, over coming decades, crude oil will decline in time even with the coming production in fields previously discovered but not yet fully under production. (Thus, of course, there is the importance of expanding non-conventional sources of liquids and other countermeasures, with every last little change down to the moderate number of electric vehicles on the roads in the next couple decades all adding up to help).

To revisit before this proceeds utterly further from the original topic, this debate was sparked back on page 2, where I was pointing out "that's why, for example, if America someday needed to produce 10% of its irrigation water by desalination, the previously illustrated $33 per person cost [including energy expenses] for that is relevant." Admiral Valdemar was arguing against my statement with his extreme energy collapse prediction that I regard as excessive. While we aren't going to lose the capability to build some desalination plants when needed and power them, we do have current and incoming economic stresses, though.
Like I said, dozens. I've previously worked out the math since I research & write energy & trade policy reports for my government.
Alright. It wasn't obvious at first glance that you had done calculations or had a good source. But indeed, your figures for the number of nuclear power plants there do have a basis, and I can see that when even my own recent back-of-envelope estimates give a comparable order of magnitude.
This is why there's a lot of research & proposals to adapt CANDU nuclear plants for oil sands production, both to generate the raw steam for oil extraction and producing electricity to crack water for the hydrogen used in upgrading the oil. We'd also need them to run desalination plants so we don't use up all the fresh water in the area.
Good.
User avatar
J
Kaye Elle Emenopey
Posts: 5836
Joined: 2002-12-14 02:23pm

Re: No topsoil left in Britain in 60 years

Post by J »

Tritonic wrote:This could be considered unfair since I'm talking about a different person's projections, when your graph is from a Mr. Laherrere, not my Dr. Campbell example. But I just want to illustrate how important it is not to jump to conclusions when some individuals contradict the IEA.
I've covered this in a debate some time back, but in short, Dr. Campbell goofed, the assumptions behind his method always result in a peak year that's just a few years in the future.
2)That you state peak production was 5 years ago reinforces something previously suspected: Again there is too much focus on conventional crude alone and not all liquids. After all, as pointed out before, IEA data shows that current total production is 3% higher now at 86.5 million barrels/day than the 83.8 million barrels/day it was back 5 years ago in 2005.
The peak for conventional crude was 2005, the all liquids peak was 2008. From your own chart and all other data I have seen, we're still not back to 2008 levels for all liquids nor 2005 levels for conventional crude.

With regards to natural gas & natural gas liquids, it buys us some time but other than Russia, Iran, and Qatar the world isn't exactly overflowing with gas.

Image
Also, this. Very different from the IEA claims.
4) If your views contradictory to the International Energy Agency were shared within the industry expert community (and, most of all, if Admiral Valdemar's very extreme 2012 predictions were), we would see a huge rise in futures prices already, not happening to remotely the degree your predictions would require. Many would be trying to stock up on oil now to resell at hundreds of dollars a barrel in several years, if your predictions were accepted.
A small but increasing number are coming around to my views. Oil is a resource which most just take for granted and it's hard to break that view. I have a friend in the industry and she says it's like the subject which must not be spoken of, but it is dicussed by some anyway if one reads between the lines in their internal memos and some of the press releases. I've heard similar stories related by Prof. Deffeyes (he was one of my undergrad thesis advisors) from his time in the oil industry at Shell, it's not something the industry likes to talk about.
To revisit before this proceeds utterly further from the original topic, this debate was sparked back on page 2, where I was pointing out "that's why, for example, if America someday needed to produce 10% of its irrigation water by desalination, the previously illustrated $33 per person cost [including energy expenses] for that is relevant." Admiral Valdemar was arguing against my statement with his extreme energy collapse prediction that I regard as excessive. While we aren't going to lose the capability to build some desalination plants when needed and power them, we do have current and incoming economic stresses, though.
Getting back on topic, we could build all the desalination plants and the power plants to run them all, but they'd have to be coal fired generating stations for the most part. I'd love to build 1000 nuke plants, upgrade the power grid and move towards electrified rail and electric cars for transportation but that's not happening anytime soon even if we had the money and wanted to do it right now.

The US, in its wisdom, outsourced all the infrastructure for making nuke plant pressure vessels to Japan & South Korea. I believe there's around a half dozen plants in the world which can make the one piece steel forgings used in the pressure vessels, those forges aren't getting built overnight and they can only make a handful of pressure vessels a year. It takes time to build the infrastructure and expertise needed to build all the parts in a nuke plant so even if we started right now (and shot all the NIMBYs while we're at it) it would still be quite some time before we can start popping them out like mushrooms. Unless you guys want to build a bunch of CANDUs, no big pressure vessels but it's a bit of a plumbing nightmare and you'd be enslaved to your northern neighbours. :wink:

We can eventually build all nuke plants, greenhouses, hydroponics equipment and all the other goodies but it takes time & will. Which means it'll never get done in the US since it doesn't have the will, nor for the most part the need to do so. America, despite all the problems with global warming, drought and whatnot still has a large surplus of land & food production, and until that's gone the alternatives will remain a small niche in the overall scheme.
This post is a 100% natural organic product.
The slight variations in spelling and grammar enhance its individual character and beauty and in no way are to be considered flaws or defects


I'm not sure why people choose 'To Love is to Bury' as their wedding song...It's about a murder-suicide
- Margo Timmins


When it becomes serious, you have to lie
- Jean-Claude Juncker
User avatar
K. A. Pital
Glamorous Commie
Posts: 20813
Joined: 2003-02-26 11:39am
Location: Elysium

seeRe: No topsoil left in Britain in 60 years

Post by K. A. Pital »

Iosef Cross wrote:Hi Bush. The oil problem is real, even thought isn't that big. For most uses, oil consumption can be greatly reduced:

In electric energy production, oil can be replaced with coal.
Which will lead to rapid depletion of coal, and will require lots of infrastructure reconstruction. Financial stress, and not a permanent true sustainability shift since coal would likewise deplete.
Iosef Cross wrote:In transportation, oil can be replaced with coal for trains and ships, with transport most of the world's cargo.
Which would increase coal consumption, and require a complete reconstruction of the train and ship park of the world - immense stress again.
Iosef Cross wrote:Much of oil production is consumed by private cars. Specially in the US. This kind of luxury consumption can be cut easily by: Reducing average engine size, increasing engine efficiency and decreasing use.
Exactly. But when did you see First World nations ever cut down their luxurious lifestyles' consumption? I haven't seen that, for once.
Iosef Cross wrote:Also, in the US much of oil consumed is used for things like heating, with global warming this need will be cut.
Global warming is a longer process than oil depletion, though. And a very significant temperature increase would lead to more adverse consequences than oil depletion, I fear...
Iosef Cross wrote:The rate of relative decrease of oil in energy importance will be governed by it's price. If oil prices stay in the 100 dollar range and continue to increase, their relative importance will fall fast. The first types of consumption to be cut will be the consumer types, like car's demand.
Well, car demand falling will be a blow to America's terrifically inefficient cargo industry where a lot of bulk freight is moved by cars instead of rail; as well as private transportation in many nations following the US car-centric development model. This in turn will lead to a depression of industrial production, of which car and plane construction (all oil-dependent) are a major fraction. True, some nations (more rail-reliant ones, those who have more nuclear and hydro power) will be best fit to deal with the transition. However, many nations, especially those who lack own natural resources (e.g. Japan) will see a huge stress.
Lì ci sono chiese, macerie, moschee e questure, lì frontiere, prezzi inaccessibile e freddure
Lì paludi, minacce, cecchini coi fucili, documenti, file notturne e clandestini
Qui incontri, lotte, passi sincronizzati, colori, capannelli non autorizzati,
Uccelli migratori, reti, informazioni, piazze di Tutti i like pazze di passioni...

...La tranquillità è importante ma la libertà è tutto!
Assalti Frontali
User avatar
Surlethe
HATES GRADING
Posts: 12269
Joined: 2004-12-29 03:41pm

Re: No topsoil left in Britain in 60 years

Post by Surlethe »

The real questions in this debate are not whether peak oil is happening (or will happen), but rather economic:
  • How quickly will depletion occur relative to energy demand growth?
  • How quickly will prices rise?
  • How long will the infrastructure adjustment take and how much will it cost?
  • What technological innovations will occur to increase efficiency?
    and
  • Which alternative energy sources will be most efficient?
These questions are ultimately quantitative. If oil depletion is spread out over 200 years, prices rise gradually, and the infrastructure shift takes a century, it's no big deal; if it happens in 10 years and prices skyrocket, we're looking at amazing slack in the economy for decades while capital moves from oil-based to electricity-based pursuits.
A Government founded upon justice, and recognizing the equal rights of all men; claiming higher authority for existence, or sanction for its laws, that nature, reason, and the regularly ascertained will of the people; steadily refusing to put its sword and purse in the service of any religious creed or family is a standing offense to most of the Governments of the world, and to some narrow and bigoted people among ourselves.
F. Douglass
User avatar
Kuroji
Padawan Learner
Posts: 323
Joined: 2010-04-03 11:58am

Re: seeRe: No topsoil left in Britain in 60 years

Post by Kuroji »

Stas Bush wrote:But when did you see First World nations ever cut down their luxurious lifestyles' consumption? I haven't seen that, for once.
While it's not actively cutting down, you may notice the trend for automobiles globally has involved lighter vehicle weights and decreased engine size as well as increased fuel economy. Most tech items in terms of electronics, especially televisions but also things like light bulbs, are also becoming significantly more efficient in their use of power -- while much of this is from advances in technology such as the transition from CRT to LCD televisions and monitors, even light bulbs are affected. Incandescent bulbs are on the market that provide the same output but use about twenty percent less power, not to mention fluorescent bulbs hitting it big the last few years, and LED bulbs will have their day in the sun soon and they use a handful of watts at most.

Unfortunately, you won't really see anyone cutting back on things that they now see as necessities, for the most part. You might see people who'll give up driving big cars perhaps, but they'll still drive a car instead of using a bicycle. They'll still have a television or two, and a computer or two. But at least it's some movement in a positive direction...
Steel, on nBSG's finale: "I'd liken it to having a really great time with these girls, you go back to their place, think its going to get even better- suddenly there are dicks everywhere and you realise you were in a ladyboy bar all evening."
Tritonic
Youngling
Posts: 60
Joined: 2010-04-28 08:23pm

Re: No topsoil left in Britain in 60 years

Post by Tritonic »

J wrote:The peak for conventional crude was 2005, the all liquids peak was 2008. From your own chart and all other data I have seen, we're still not back to 2008 levels for all liquids nor 2005 levels for conventional crude.
Image

There are other interpretations of that graph of recent quarterly fluctations, such as that world oil demand reached its lowest point from the economic recession during the first half of 2009, leading to oil producers letting production decrease to keep prices and profits from dropping lower. Then the economies of some countries started to get going again, leading to now a rise in demand with some suppliers increasing production to handle it. Let's see what is the top in another year.

We're mainly staying around OPEC's $70-$80/barrel price target range, due to the way supply and demand have been semi-matched:
While OPEC has not formally set $70 to $80 as a price target, Saudi Arabia’s oil minister, Ali al-Naimi, has been praising that mark for months and many of Riyadh’s OPEC colleagues have made similar remarks.<snip>

While many in OPEC have been informally raising supply since mid-2009, Saudi Arabia, Kuwait and the United Arab Emirates have kept output closer to the levels agreed in late 2008 designed to combat lower demand due to the recession.
http://www.dailystar.com.lb/article.asp ... z0mlvqtYug
J wrote:Very different from the IEA claims.
That is very different from other forecasts.

Natural gas in North America, an average view of forecasts from various industry organizations:

Image

World production estimates of the IEA:

Image
J wrote:With regards to natural gas & natural gas liquids, it buys us some time but other than Russia, Iran, and Qatar the world isn't exactly overflowing with gas.
Image

Two points:

1) Given your emphasis on declining crude oil discoveries since the 1960s, the contrast of the above is huge. Natural gas known proven reserves actually have increased over time.

2) Now for an extremely important, counterintuitive observation:

Let's compare the proven reserve figure from the graph above to consumption. Consumption of natural gas in the U.S. has been about 20+ trillion cubic feet (TCF) a year since the 1970s:

Image

(Of that, very little was imported).

But proven U.S. reserves in 1977 of natural gas were under 210 TCF (first chart above).

So we "should" have run out of natural gas by about ten years later, running out entirely by like 1987-1988, if naively dividing the prior proven reserve figure by the consumption rate. Indeed that kept happening repeatedly, what might to a naive analysis look like a strangely constantly receding horizon. Every past decade, at the time, we superficially appeared only around 10 years away from running out of natural gas.

So a naive analysis would say that the U.S. doesn't have much natural gas, indeed (incorrectly) concluding that we will run out by soon after 2020. After all, we have about 250 TCF "proved reserves" right now, and we're consuming around 23 TCF/year, with by far the bulk of it coming from domestic sources. But such a naive analysis would be the same one which would have predicted, during the 1970s, a depletion before 1990 (or, during the 1980s, predicted a depletion well before 2000).

In short, such an analysis method would be utterly wrong. Indeed, that would be apparent even from considering the following alone:

Image

After all, the industry wouldn't be increasingly building so many natural gas power plants today if expert analysis judged they were going to lose their money from the fuel for them soon becoming unaffordable.

What is really going on, though, is such all highlights how "proven reserve" figures of natural gas have always been only a small fraction of the total resources.

Each decade, companies have done enough exact and expensive surveying that their needs for the next few years have gotten moved into the "proven reserves" category. But we still have an approximate idea of how much natural gas is affordably recoverable, even though the bulk of it is not surveyed to exactly that degree yet. The government's EIA has determined that natural gas resources, affordable under present economics, amount to around 1750 TCF within the U.S.

In other words, given that consumption is around 23 TCF/year, we have a natural gas supply, domestically alone, which would last at the current rate until like 2086. Of course, that's before considering increased usage over time, yet that's also before considering how economics or technological change could make additional resources competitive enough to extract. There are major known extra resources which aren't counted in the 1750 TCF figure due to being out of current development range or due to being currently uneconomical. Such range up to a 200000 TCF estimated potential supply of methane hydrates if such progressed from test rigs to production, depending on what fraction of it was competitive to extract.

Image

So, although not unlimited, U.S. natural gas reserves will last for some decades to come. And the above is all despite the U.S. having a mere 4.5% of the world's "proven reserves" of natural gas combined with 21.4% of its consumption. The world as a whole has a reserves to consumption rate ratio 4.8 times that of the U.S., which speaks much about how far the world is from running out of natural gas very soon.

Like the U.S. figures, world natural gas proven reserves have been increasing over time too:

Image

Of course, the increase is really the technicality of changing the classification of fields from one category to another: The reason they've been able to so increase over time is that the "proven reserves" of the past and today are just a small portion of the much greater total pool of natural gas resources. Such helps buy much time for progress towards a more electric-based transportation system, public or private vehicles, assisted by continuing improvements in tech.
I've heard similar stories related by Prof. Deffeyes (he was one of my undergrad thesis advisors) from his time in the oil industry at Shell, it's not something the industry likes to talk about.
There's a lot of talking about it, so far as the IEA represents the industry, within their special resources & reserves publication, which mentions peak oil repeatedly in the foreword, although in a context of why they disagree with the rapid decline predictions of some within the public. For instance, "current worldwide average recovery rates for oil are roughly 35%," while they later in figure 2.17 on page 62 show that surfactants can raise recovery percentages within a field to 75%, although not done during a time of low oil prices due to a relatively high cost of $90 (inflation-adjusted) a barrel.
We can eventually build all nuke plants, greenhouses, hydroponics equipment and all the other goodies but it takes time & will. Which means it'll never get done in the US since it doesn't have the will, nor for the most part the need to do so.
All those much depends on perceived need at the time, as you imply (or market competitiveness, which changes with technology, such as the major progress over the past few years in reducing desalination plant expense). BTW, though, a company received a federally supported loan guarantee two months ago for two new nuclear reactors in Georgia. Such and another couple elsewhere could mark the first new nuclear reactors begun in decades in the U.S.
Tritonic
Youngling
Posts: 60
Joined: 2010-04-28 08:23pm

Re: No topsoil left in Britain in 60 years

Post by Tritonic »

I wrote:For instance, "current worldwide average recovery rates for oil are roughly 35%," while they later in figure 2.17 on page 62 show that surfactants can raise recovery percentages within a field to 75%, although not done during a time of low oil prices due to a relatively high cost of $90 (inflation-adjusted) a barrel.
My wording there wasn't quite right. More accurately, they showed "up to" almost 75% oil-in-place recovery sometimes, not that the recovery factor would always reach that high with such methods. It depends of course on the individual field. In fact, let's insert the graph:

Image

Although the document is 2005, this one graph unusually used older 1990 dollars, so all the above cost figures may be multiplied by 1.6x for inflation.

In all aspects, the IEA strongly emphasizes the effect of technological refinements which occur over the decades, and there are examples such as the following (in this case, natural gas to liquid fuel conversion plants becoming more affordable):

Image
Tritonic
Youngling
Posts: 60
Joined: 2010-04-28 08:23pm

Re: No topsoil left in Britain in 60 years

Post by Tritonic »

Surlethe wrote:The real questions in this debate are not whether peak oil is happening (or will happen), but rather economic:
Fundamentally, yes. Not everyone would use the term "peak oil" with its associated connotations, but, of course, nobody thinks oil is unlimited, with this being a matter of at least partially quantifying, within some wide range, the future.

The IEA's estimated cost curve for what volumes of resources become available at what price:

Image

Of course, prices have to stay substantially above those ranges for a sustained period of time (i.e. at least multiple years straight) to strongly inspire development. That's in utter contrast, for instance, to how the oil price bubble of two years ago crashed so fast as to get a number of projects canceled before they could get going.

Graphs like the preceding highlight how the situation for the world in the future may be exceptionally different than it was for any individual historical oil field: An individual field's decline doesn't determine the market price, but, depending on assumptions, global decline in the conventional crude component of liquids could change the very economic determinations of whether it was worthwhile to take extreme measures of unprecedented expense to raise recovery fractions, measures to slow the decline to help give time for other sources to ramp up.

IEA special report on resources, reserves, economics, and, to a degree, the future.
User avatar
J
Kaye Elle Emenopey
Posts: 5836
Joined: 2002-12-14 02:23pm

Re: No topsoil left in Britain in 60 years

Post by J »

Tritonic wrote:Natural gas in North America, an average view of forecasts from various industry organizations:

Image
I can't speak of the US since I'm not as familiar with their industry, but the projections for Canada look far too optimistic.

We're well past the halfway mark in depleting our natural gas
Image

We know this because production per well has cratered, and only a drilling frenzy is keeping production more or less stable for now.
Image

We can only double the number of wells every 5 years for so long before the math makes it physically impossible to continue. I don't believe it's possible to stabilize production at current levels for the next 10 years, production has been slowly declining since 2001 and I believe that trend will continue. (see NEB spreadsheets)
Two points:

1) Given your emphasis on declining crude oil discoveries since the 1960s, the contrast of the above is huge. Natural gas known proven reserves actually have increased over time.

2) Now for an extremely important, counterintuitive observation:

But proven U.S. reserves in 1977 of natural gas were under 210 TCF (first chart above).

So we "should" have run out of natural gas by about ten years later, running out entirely by like 1987-1988, if naively dividing the prior proven reserve figure by the consumption rate. Indeed that kept happening repeatedly, what might to a naive analysis look like a strangely constantly receding horizon. Every past decade, at the time, we superficially appeared only around 10 years away from running out of natural gas.
That's because the US had a big discovery spree in the late 1970's, and those discoveries hadn't yet been added to the proven reserves.
Image

What is really going on, though, is such all highlights how "proven reserve" figures of natural gas have always been only a small fraction of the total resources.

Each decade, companies have done enough exact and expensive surveying that their needs for the next few years have gotten moved into the "proven reserves" category.
And then this happens
Excerpt:
Shell, which yesterday announced plans to replace a century-old dual ownership structure with a single company, gave warning that it could be forced to lower its 14.35 billion barrels of reported proved oil reserves by as much as 900 million barrels. The reduction would come on top of a 25 per cent writedown in Shell’s oil and gas reserves this year, which led to the ousting of Sir Philip Watts as chief executive.
Oops. Shell wasn't the only company which had to revise its reserves downwards.
But we still have an approximate idea of how much natural gas is affordably recoverable, even though the bulk of it is not surveyed to exactly that degree yet. The government's EIA has determined that natural gas resources, affordable under present economics, amount to around 1750 TCF within the U.S.
I count about 770 TCF or so. Inferred reserves (we think we'll get xx% more out of this field in 10 years) and undiscovered reserves shouldn't be counted in the technically recoverable reserves number. One could arguably count some of the inferred reserves towards the amount which is recoverable, but not undiscovered reserves since they're only thought to exist and haven't been surveyed, drilled, nor proven in any way.
Tritonic wrote:My wording there wasn't quite right. More accurately, they showed "up to" almost 75% oil-in-place recovery sometimes, not that the recovery factor would always reach that high with such methods. It depends of course on the individual field. In fact, let's insert the graph:
The effectiveness of enhanced recovery methods depends on the reservoir type, when we look at the oil fields types where most of the world's oil comes from the amount of ultimately recoverable oil tops out at around 40-45%. It's only in a few exceptional fields such as some of the onshore fields in Texas where 75% or even up to a bit over 80% of the oil can be pulled out.
Tritonic wrote:The IEA's estimated cost curve for what volumes of resources become available at what price:
Oh dear. Oil shale recoverable at $25-$70 per barrel. I'd love to know how they came up with those numbers.
This post is a 100% natural organic product.
The slight variations in spelling and grammar enhance its individual character and beauty and in no way are to be considered flaws or defects


I'm not sure why people choose 'To Love is to Bury' as their wedding song...It's about a murder-suicide
- Margo Timmins


When it becomes serious, you have to lie
- Jean-Claude Juncker
Tritonic
Youngling
Posts: 60
Joined: 2010-04-28 08:23pm

Re: No topsoil left in Britain in 60 years

Post by Tritonic »

J wrote:I can't speak of the US since I'm not as familiar with their industry, but the projections for Canada look far too optimistic.
The projections graph I posted is also within an official 2020 outlook document of the Canadian government, page 29. You may disagree, but it is approximately the standard estimate.
J wrote:We're well past the halfway mark in depleting our natural gas

<snip chart>
The creator of that chart selectively chose what data to assemble (in a manner keeping a reader from learning the key aspect of how fully surveyed natural gas reserves in each decade have been a mere minority of total resources). Such made me wonder where it came from, how unbiased of a source. It was from this kind of marketing website, someone trying to convince people to sign up with their email addresses:
For years, my Pure Energy readers have been taking advantage of Canada's rich natural resources. Just one of our Canadian oil plays has already given us a 300% return. Don't you think it's time for you to get in on this now while you still can?
http://www.energyandcapital.com/article ... canada/458

Anyway, look closely at the numbers in the chart. It is saying that, in 2005, there were 1.619 trillion m^3 Canadian remaining established reserves of natural gas. Since a cubic meter is 35.31 cubic feet, that'd be 57.2 Tcf reserves left back in 2005, five years ago. The current annual rate of Canadian natural gas production is 5.8 to 6.0 Tcf (the figure for 2009), meaning around 60 TCF per decade. So, what if one follows to its full conclusion the incorrect impression given from the chart? One would naively conclude Canadian natural gas production 2005-2015 would deplete about all reserves, with production crashing towards near zero within several years from now (2010). Seeing anything wrong yet?

Let's compare to the Canadian government's official info in contrast: Projected Canadian natural gas production is estimated to be about the same in 2020 as in 2007, about 5.8 Tcf/yr (dipping slightly to 5.3 Tcf/yr by around 2014, then pulling back up).

The one nice thing about the chart from the marketing website is that it was made back in 2005, five years ago, with an implied prediction thus able to be already disproven using today's 2010 hindsight.

Specifically, what actually happened is that the more recent 2009 figure for Canadian proven natural gas reserves was literally slightly greater than it was back in 2005, even after much additional consumption during those years. Such is instead of how that chart suggested there were 57 Tcf Canadian natural gas reserves in 2005 which "should" have been almost halved by the next four years of 6 Tcf/year production. That's due to the whole "proven reserves" versus total resources distinction so emphasized in my prior post, utterly paramount for any understanding of natural gas supply.
J wrote:We know this because production per well has cratered, and only a drilling frenzy is keeping production more or less stable for now.
The official document's graph there:

Image
Well number on page 11
J wrote:We can only double the number of wells every 5 years for so long before the math makes it physically impossible to continue.
Is it a trend that can be extrapolated indefinitely? Reportedly, well number peaked back in 2005 then dropped significantly lower:
In Canada, while drilling has tapered off in recent years, producers still drilled over 12,000 wells in 2007, from roughly 9,000 in 2000. (Note: Drilling peaked at 18,500 in 2005.)
http://www.nrcan.gc.ca/eneene/pdf/revrev-eng.pdf

I don't know how common the following is in Canada, but the industry has undergone technological advancements over recent decades, with increased usage of new methods such as slimhole drilling, for a given expense being able to drill greater numbers of small well holes with a lesser footprint each:
Slimhole drilling is exactly as it sounds; drilling a slimmer hole in the ground to get to natural gas and oil deposits. In order to be considered slimhole drilling, at least 90 percent of a well must be drilled with a drill bit less than six inches in diameter (whereas conventional wells typically use drill bits as large as 12.25 inches in diameter). Slimhole drilling can significantly improve the efficiency of drilling operations, as well as decrease its environmental impact. In fact, shorter drilling times and smaller drilling crews can translate into a 50 percent reduction in drilling costs, while reducing the drilling footprint by as much as 75 percent. Because of its low cost profile and reduced environmental impact, slimhole drilling provides a method of economically drilling exploratory wells in new areas, drilling deeper wells in existing fields, and providing an efficient means for extracting more natural gas and oil from undepleted fields.
http://www.naturalgas.org/environment/technology.asp
J wrote:I don't believe it's possible to stabilize production at current levels for the next 10 years, production has been slowly declining since 2001 and I believe that trend will continue.
Canada indeed has relatively small natural gas potential, not remotely like America. But your government expects around 5.8 Tcf/year in 2020, though, similar to the 2007 figure. Page 29.
Post Reply