
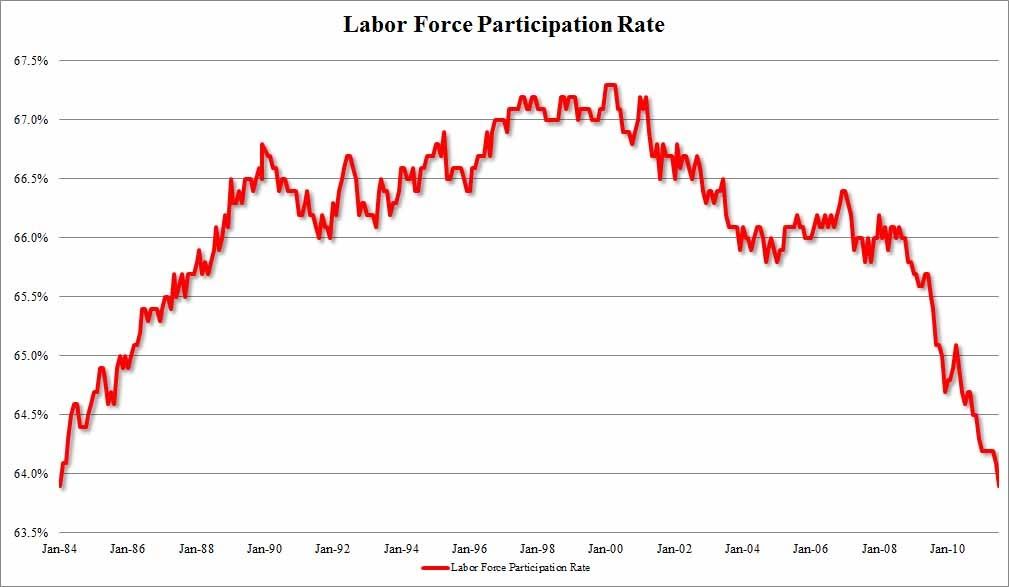
The U* all move together very tightly. For example, in this situation you describe, where the labor force participation rate shrinks, U6 would go up as well because the workers who were previously marginally unattached become simply unattached, moving further away from workforce participation.Simon_Jester wrote:And yet U3 won't count them. U3 can actually go down after a protracted economic crunch, even if no new full-time jobs are being created, if people are ceasing to try and find work because they've given up. Or if jobs are split into part-time employment for two people who don't make enough to support themselves separately- two people working 20 hour weeks instead of one person working a 40 hour week is counted as higher employment under U3.
*****
For those interested, here's a good way to think about the different measures of unemployment. Imagine taking everybody in the US and grouping them in loose order from "completely unemployable" and "completely unemployed and not even thinking about looking for work" to "working full-time and very satisfied with the job." It might look something like this:
Code: Select all
[not looking for work] -------------- [looking for work] ------------- [have job, will take better] ----------------- [have stable job]
This isn't easy. At any given moment, vast numbers of people are moving around in this line. If someone who wasn't working decides to get a job, he moves from the left toward the right. If someone finds a better job and quits his current job, he drops from stable job to looking for work then back up to stable job. If someone rips his arm off in a factory and retires with SS disability insurance, he goes from have stable job all the way down to not looking for work. And so on. Remember, we have about 300 million people lined up here, and there are hundreds of thousands of jobs created and destroyed every day.
So what can we do? We're interested in unemployment. What's the unemployment rate? It's the proportion of workers who don't have jobs. But what are "workers"? Obviously people who don't want to work or can't work count -- people who are happy being stay-at-home parents, or volunteering their time, or are too old or are permanently disabled. But what if you're not looking for a job? What if you want a job, but you don't think there are any to be had near you? What if you're between jobs? And what does it mean to "not have a job" -- does mowing your neighbors' lawns count? Does temp work count? What if you're looking to find a better job? And so on.
Like I said, this is an incredibly complicated phenomenon. We're talking about quantifying the hopes and dreams of three hundred million people. It's going to be hard to do this in one number. What's better than one number? Several! We can come up with several different ways of slicing and dicing the population to measure unemployment, and each one gives us a different perspective of the labor force.
But each number is measured in the same basic way. We make two cuts in the line above: first, we distinguish between those participating in the labor force and those not participating in the labor force. Then, we focus on the labor force and we distinguish between people who have jobs and people who don't have jobs. Finally, we figure out what proportion of the labor force has a job, and what proportion doesn't.
There are six measures of unemployment gathered by the BLS, aptly named U1 through U6. They're described here (Wikipedia). They each draw the two lines in different places, so they each give a slightly different picture of what's happening in the labor force. For instance, the commonly-cited U3 draws the "labor force" line at "those who have jobs or have looked for a job within the past month." However, U4 draws the "labor force" line at "those who have jobs, or have looked for a job within the past year." Slightly more expansive definition of the labor force, slightly different picture.
So each definition of unemployment gives a slightly different perspective on what's happening in the labor force -- think of it like the parable of the blind men and the elephant.
So there you go. That's where the different measures come in: trying to quantify patterns in an enormous, incredibly dynamic labor market.


